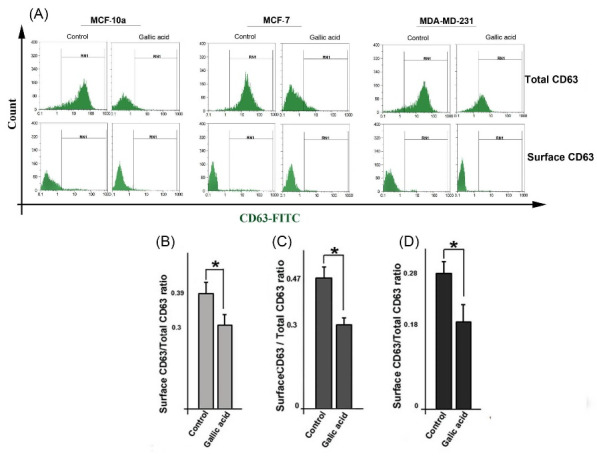
Fig. 4.

Flow cytometry analysis of the subcellular distribution of CD63 in cells. Cells were stained with a CD63-FITC antibody for measuring the percentage of total and surface CD63 protein (A) and analyzed the ratio of surface CD63/ total CD63 for MCF-10a (B), MCF-7 (C), and MDA-MB-231 (D) cells. Student’s t-test. The data represent the mean ± SD. *P < 0.05.
