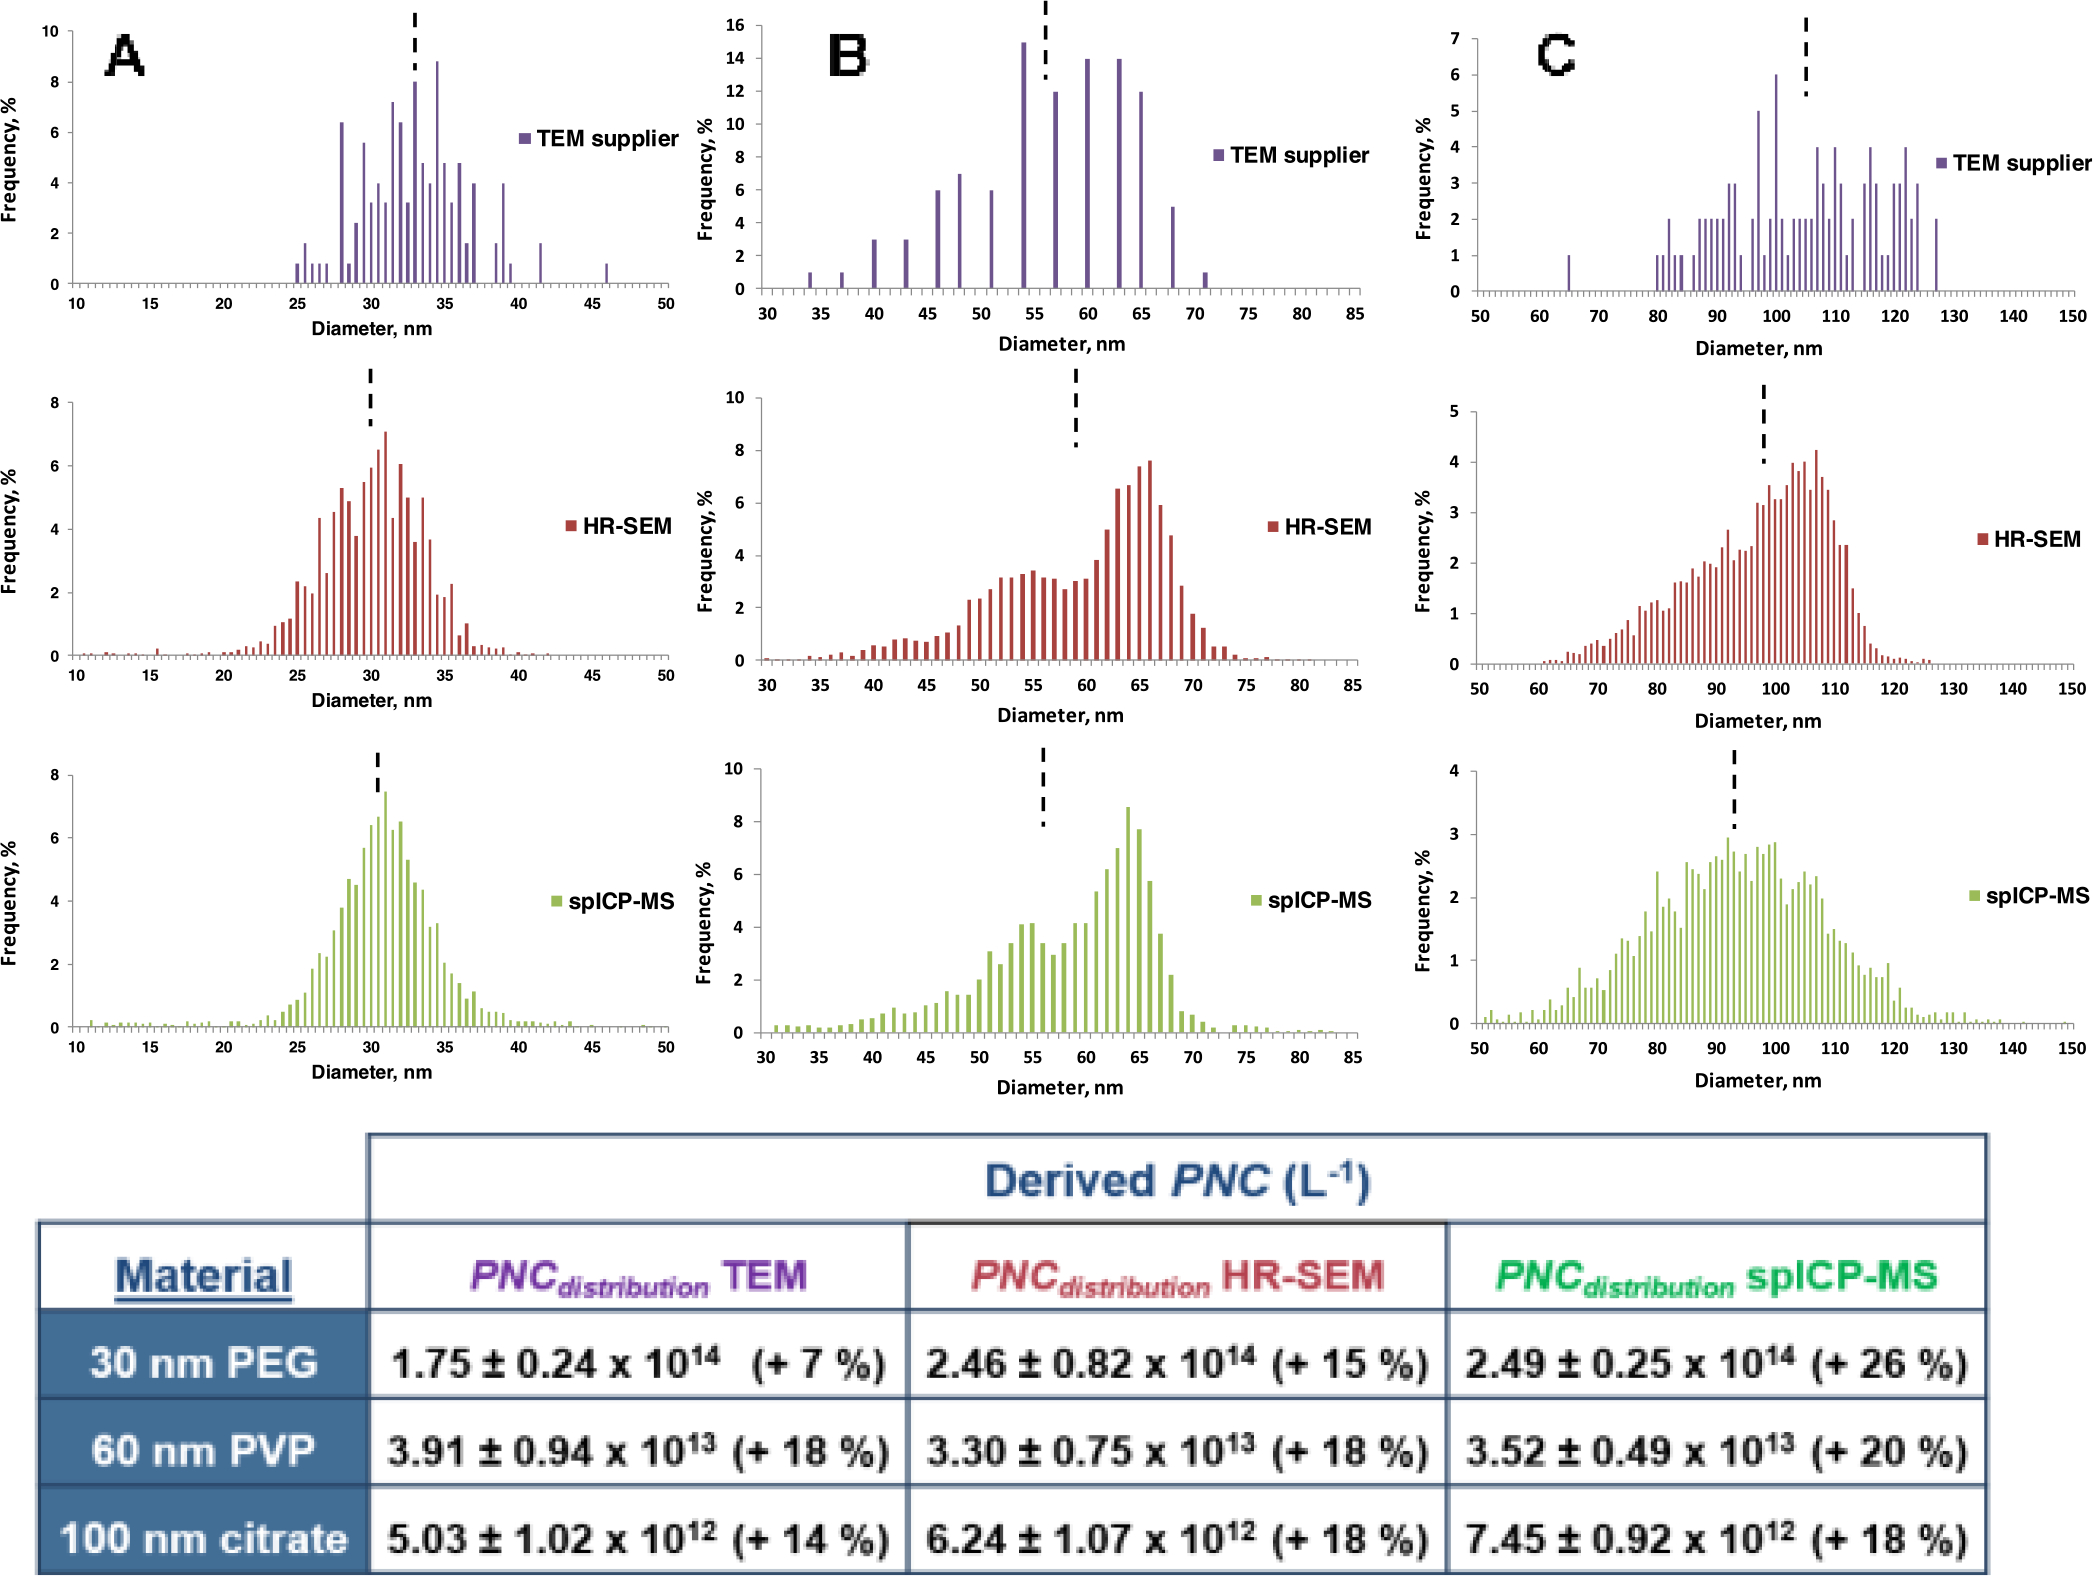
Figure 3.

Number size distribution histograms for commercial PEG-coated 30 nm AuNPs (A), PVP-coated 60 nm AuNPs (B), and citrate-coated 100 nm AuNPs (C) measured by TEM (provided by the manufacturer) (purple),34 HR-SEM (dark red),32 and spICP-MS (green).32 Vertical black dashed lines indicate mean particle diameters. Adapted from ref 32. PNCdistribution values calculated using in-house Au mass fractions and PSD reported by TEM,34 HR-SEM,32 and spICP-MS32 are depicted in the table. Listed uncertainties correspond to U95% C.I. Relative differences between PNCdistribution and PNCmean are shown in parentheses.
