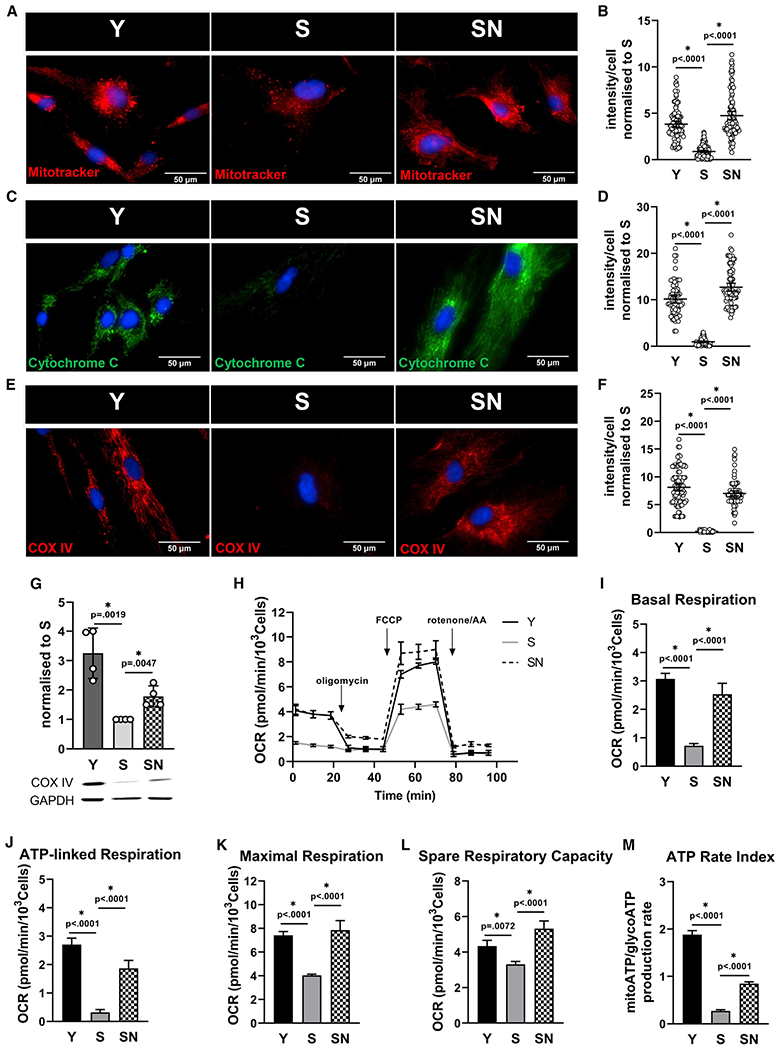
Figure 1. Impaired mitochondrial function in senescent mesenchymal stem cells restored by NANOG.

(A) Representative images of Mitotracker Red live stain of Y, S, and SN cells; scale bar represents 50 μm.
(B) Quantification of Mitotracker Red intensity per cell; data shown as mean ± 95% confidence interval (CI) for >100 cells.
(C) Immunostaining for cytochrome c; scale bar represents 50 μm.
(D) Quantification of cytochrome c intensity per cell; data shown as mean ± 95% CI for >100 cells.
(E) Immunostaining for mitochondrial complex IV (COX IV); scale bar represents 50 μm.
(F) Quantification of COX IV intensity per cell; data shown as mean ± 95% CI for >100 cells.
(G) Western blot for COX IV and quantification (n = 3 independent experiments). GAPDH served as loading control.
(H) Measurement of oxygen consumption rate (OCR) using Seahorse extracellular flux analyzer.
(I–L) Basal respiration (I), ATP-linked respiration (J), maximal respiration (K), and spare respiratory capacity (L) calculated from the OCR data in (H).
(M) ATP rate assay using Seahorse extracellular flux analyzer, demonstrating mitochondrial ATP production rate significantly reduced in S cells.
