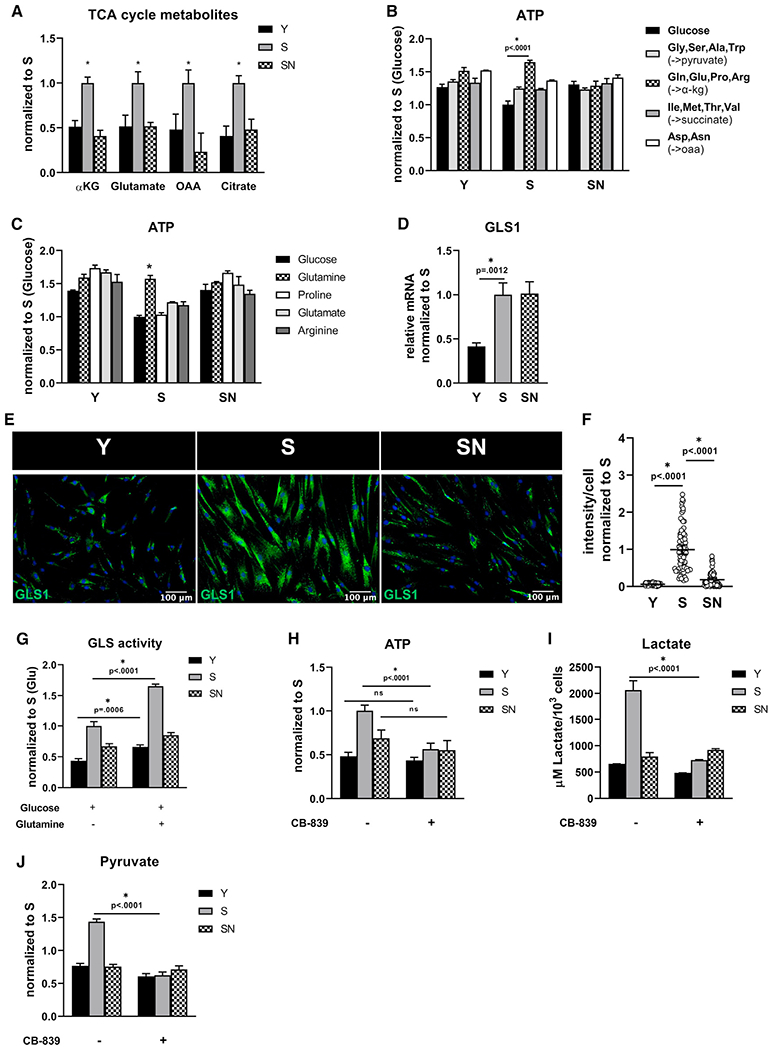
Figure 2. Increased glutamine consumption by senescent MSCs.

(A)Y, S, and SN cells were starved for 30 min and then stimulated with medium containing 25 mM glucose and 4 mM glutamine, followed by measurement of TCA cycle intermediates α-ketoglutarate, glutamate, oxaloacetate, and citrate and after 24hr.
(B) Intracellular ATP concentration measured after cells were fed with glucose (5 mM) alone or glucose with different cocktails of amino acids (5 mM) with different entry points into the TCA cycle.
(C) Intracellular ATP measured after cells were fed with glucose (5 mM) alone or glucose with the indicated amino acid (5 mM).
(D) Quantification of gene expression of GLS1 via quantitative RT-PCR normalized to S and internally normalized to RPL32 cycle number.
(E) Immunostaining for GLS1; scale bar represents 100 μm.
(F) Quantification of GLS1 intensity per cell; data shown as mean ± 95% CI for >100 cells.
(G) Glutaminase activity in medium containing only glucose (25 mM) or both glucose (25 mM) and glutamine (4 mM).
(H) Intracellular ATP measured in the presence or absence of GLS1 inhibitor, CB-839 (4 μM) at 24 h after treatment.
(I) Extracellular lactate concentration measured in the presence or absence of CB-839.
(J) Intracellular pyruvate concentration measured in the presence or absence of CB-839. Data in bar graphs represented as means ± SD.
