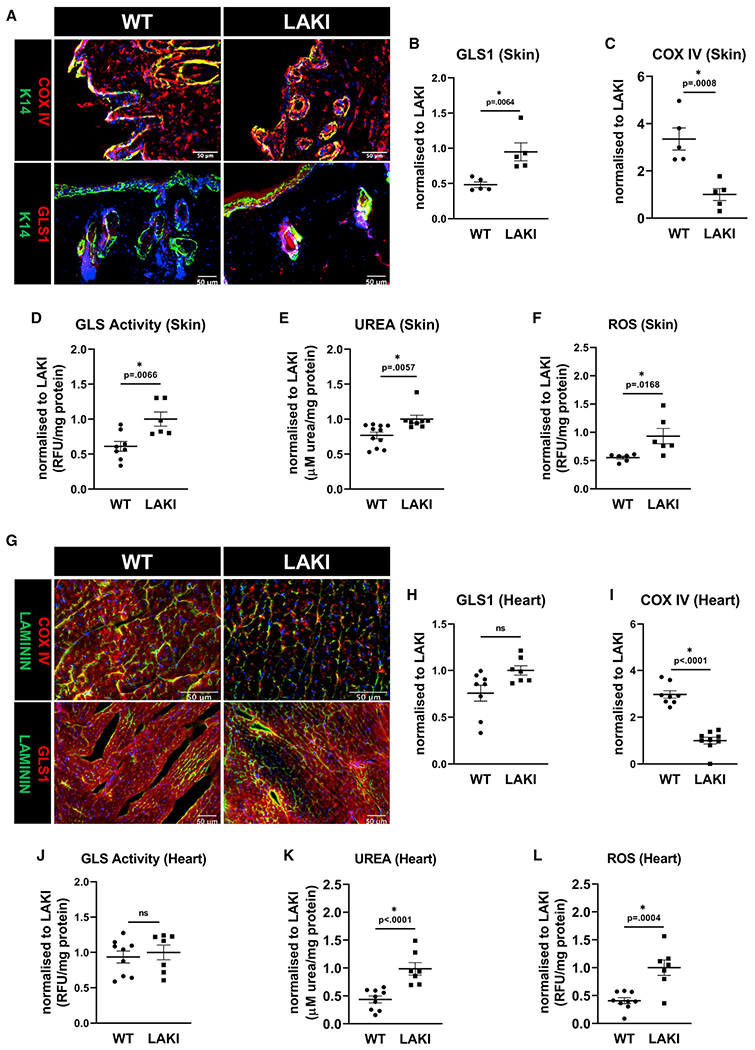
Figure 4. Increased GLS1 expression and activity were associated with urea accumulation and mitochondria dysfunction in LAKI mouse tissues.

Representative immunostaining images (A) and quantification of GLS1 (B) and COX IV staining (C) in skin. GLS activity (D), urea accumulation (E), and ROS level (F) were measured in the skin of WT and heterozygous LAKI progeria mouse (LMNAG609G/+) at the age of 10 months.
(G–I) Representative immunostaining images (G) and their quantification for GLS1 (H) and COX IV (I) in the heart tissue. Measurements of GLS activity (J), urea accumulation (K), and ROS levels (L). Data shown as mean ± SE for each cohort of animals (each bubble represents one mouse, n = 5–8). * designates statistical significance compared with LAKI (p < 0.05).
