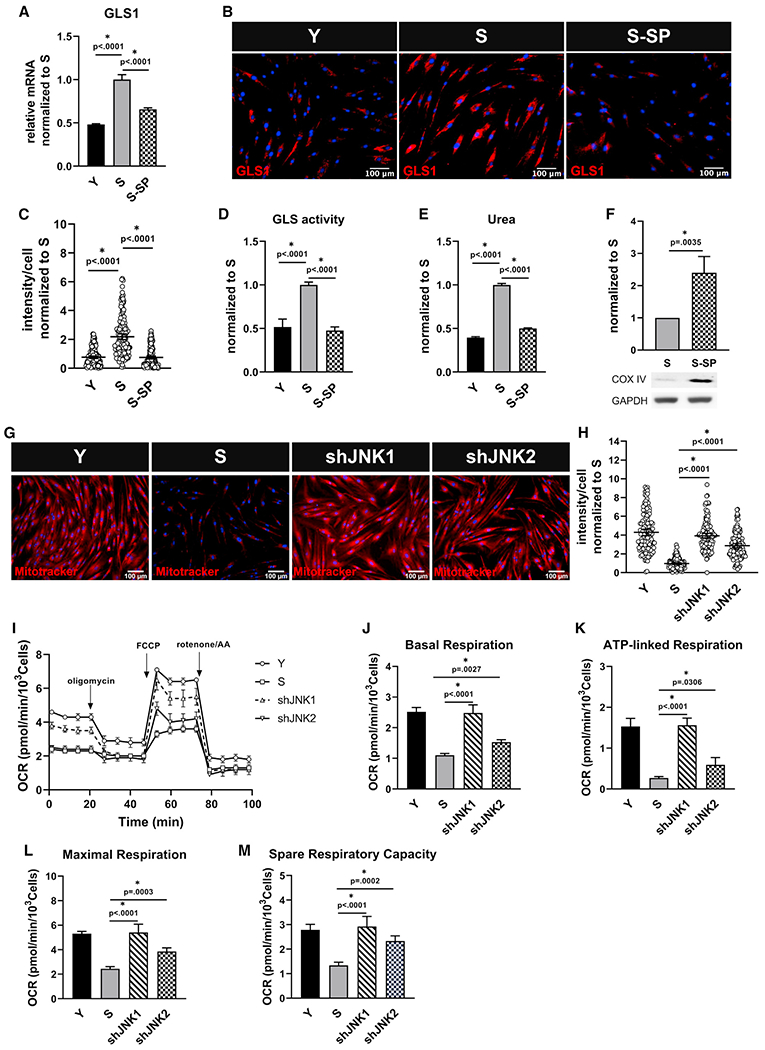
Figure 5. JNK regulates GLS and suppresses mitochondrial function in senescent cells.

Senescent MSCs were treated with SP600125 (5 μM), and (A) GLS1 expression was measured via quantitative RT-PCR normalized to S and internally normalized to RPL32 cycle number; data shown as mean ± SD.
(B) Immunostaining for GLS1; scale bar represents 100 μm.
(C) Quantification of GLS1 intensity per cell, normalized to S; data shown as mean ± 95% CI for >200 cells.
(D) Glutaminase activity measurement in Y, S, and S cells treated with SP600125, normalized to S; data shown as mean ± SD.
(E) Intracellular urea concentration, normalized to S; data shown as mean ± SD.
(F) Western blot for COX IV and quantification, normalized to S (n = 3 independent experiments). GAPDH served as loading control.
(G) Live stain images of Mitotracker Red showing upregulation of mitochondrial membrane potential in senescent cells after knocking down JNK1 or JNK2; scale bar represents 100 μm.
(H) Quantification of Mitotracker Red intensity per cell; data shown as mean ± 95% CI for >100 cells.
(I) Measurement of oxygen consumption (OCR) using Seahorse extracellular flux analyzer in Y, S, shJNK1, and shJNK2 cells.
(J–M) Basal respiration (J), ATP-linked respiration (K), maximal respiration (L), and spare respiratory capacity (M) rates calculated from the OCR data in (I).
