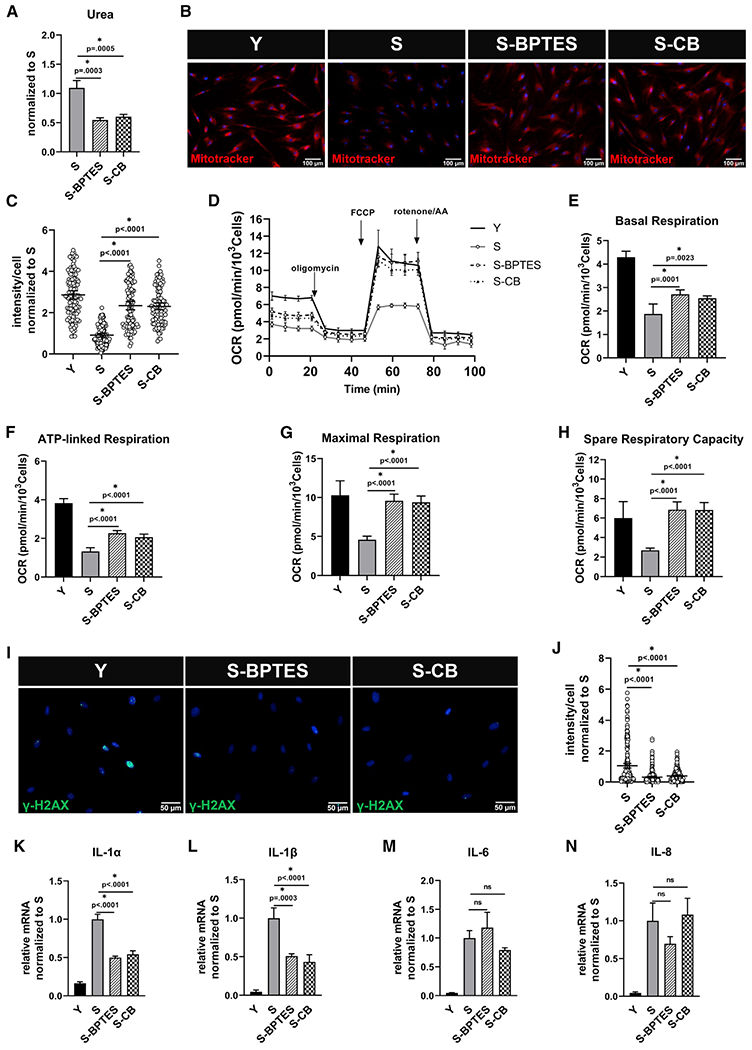
Figure 6. Inhibition of GLS1 improves mitochondrial function in senescent mesenchymal stem cells.

Senescent MSCs were treated with GLS1 inhibitor, BPTES (10 μM), or CB-839 (4 μM) or for 10 days. (A) Intracellular urea concentration measurement, normalized to S; data shown as mean ± SD.
(B) Representative images of Mitotracker Red live stain of Y, S, S-BPTES, and S-CB cells; scale bar represents 100 μm.
(C) Quantification of Mitotracker Red intensity per cell, normalized to S; data shown as mean ± 95% CI for >200 cells.
(D) Measurement of oxygen consumption rate (OCR) using Seahorse extracellular flux analyzer.
(E–H) Basal respiration (E), ATP-linked respiration (F), maximal respiration (G), and spare respiratory capacity (H) calculated from the OCR data in (D).
(I) Immunostaining for the phosphorylated form of histone H2AX (γ-H2AX); scale bar represents 50 μm.
(J) Quantification of γ-H2AX intensity per cell, normalized to S; data shown as mean ± 95% CI for >100 cells.
(K–N) Quantification of gene expression of inflammatory cytokines via quantitative RT-PCR normaliszed to S and internally normalized to RPL32 cycle number.
