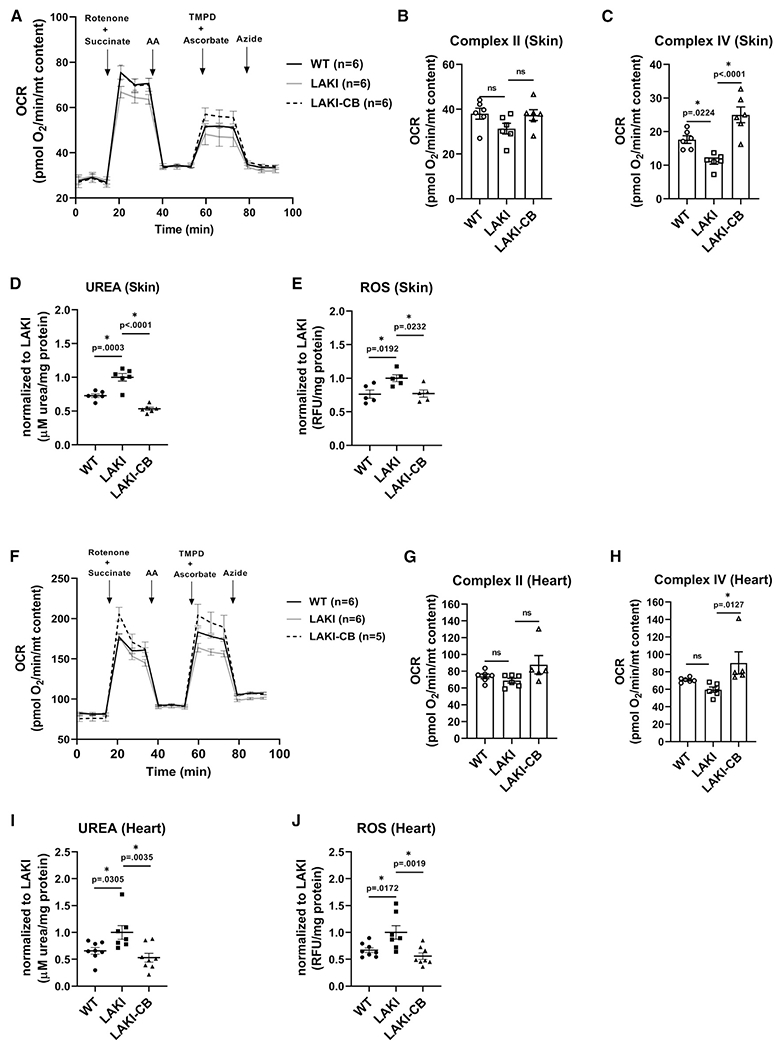
Figure 7. GLS1 inhibition improves mitochondrial function in LAKI mouse tissues.

(A) Measurement of oxygen consumption rate of isolated mitochondria from skin of WT, heterozygous LAKI progeria mouse (LMNAG609G/+) and LAKI mice treated with CB-839 (LAKI-CB); data normalized to mitochondrial content.
(B and C) Complex II and complex IV activities calculated from the OCR data in (A).
(D and E) Measurement of urea concentration and ROS level in skin tissue; data normalized to LAKI.
(F) Measurement of oxygen consumption rate of isolated mitochondria from heart tissues, normalized to mitochondrial content.
(G and H) Complex II and complex IV activities calculated from the OCR data in (F).
(I and J) Measurement of urea concentration and ROS level in heart tissue; data normalized to LAKI. Data shown as mean ± SE for each cohort of animals (each bubble represents one mouse, n = 5–8). * designates statistical significance compared with LAKI (p < 0.05).
