
Figure 3. IRF2-deficient CD8+ T cells resist exhaustion and maintain functionality in the TME.
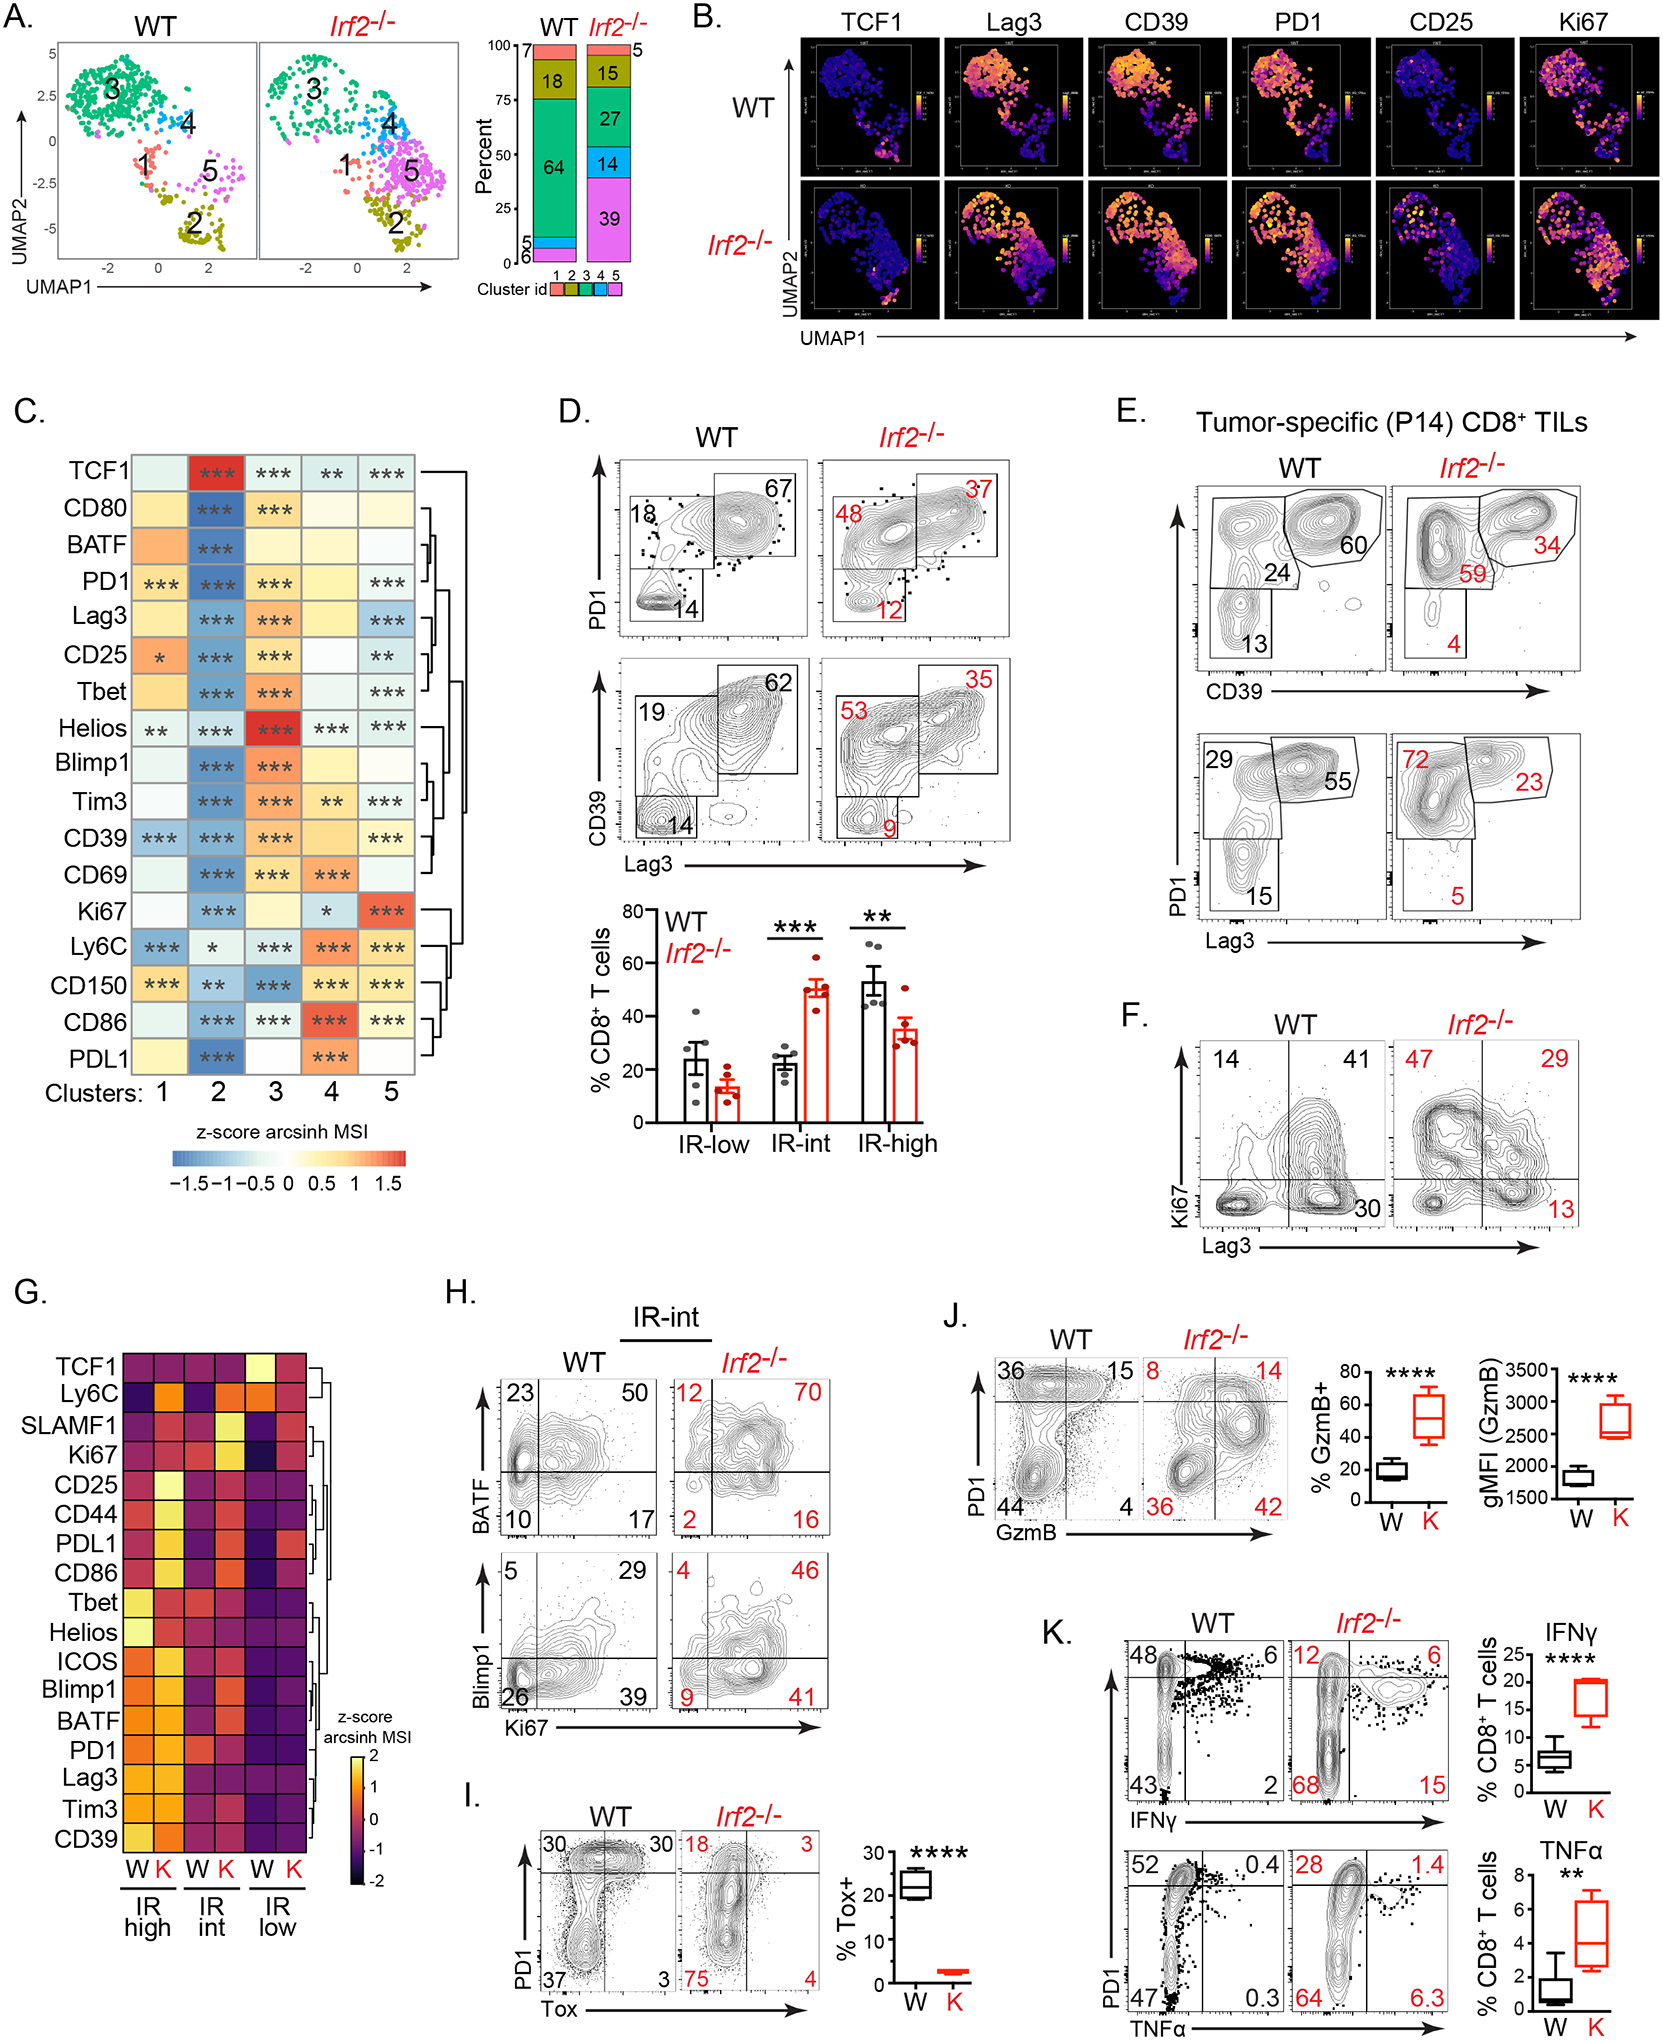
(A) UMAP plots of CyTOF data showing PhenoGraph-defined clusters of WT and Irf2−/−CD8+ TILs on day 12 after MC38 initiation. The bar graph depicts the proportion of each cluster in WT and Irf2−/− mice.
(B) UMAP plots show the single-cell expression of the indicated protein in CD8+ TILs from panel A.
(C) The heatmap represents relative expression (normalized z-scores of the arcsinh transformed mean signal intensity; MSI) of the indicated protein in each cluster from panel A compared to the other clusters combined using Wilcoxon rank-sum test.
(D) Eexpression of the inhibitory receptors (IR) CD39, PD1 and Lag3 in WT and Irf2−/−CD8+ TILs. Numbers in the plots show the percent of cells in each gate. The graph compares proportions of CD8+ T cells expressing low, intermediate or high levels of IRs combined from 4 independent experiments. Error bars represent SEM.
(E) Expression of CD39, PD1 and Lag3 in WT and IRF2−/− tumor-specific CD8+ P14 T cells from mice implanted with MC38-GP tumors. Numbers show percent of cells in each gate.
(F) Ki67 expression in WT and Irf2−/−CD8+ TILs. Numbers indicate the percent of cells in each quadrant.
(G) Heatmap depicting expression (z-score of median) of the indicated protein in IR-low, IR-int and IR-hi WT (W) or Irf2−/− (K) CD8+ TILs.
(H) BATF, Blimp1 and Ki67 expression by IR-int WT and Irf2−/−CD8+ TILs. Numbers indicate the percent of cells in each quadrant.
(I and J) PD1, Tox and GzmB expression in WT and Irf2−/−CD8+ TILs. Graphs indicate the proportions of cells expressing and the per-cell expression levels (gMFI) of the indicated protein.
(K) Flow plots show IFNγ and TNFα production in ex vivo GP33–41 peptide stimulated CD8+ TILs on day 12 after MC38-GP initiation. Graphs indicate the proportions of cells expressing IFNγ and TNFα.
Data are representative of at least three independent experiments. In each experiment, tumors from 4–7 mice were pooled from WT or Irf2−/− mice to obtain sufficient numbers of CD8+ TILs for analysis. * p<0.05, ** p<0.01, *** p<0.001, **** p< 0.0001.