Figure 4.

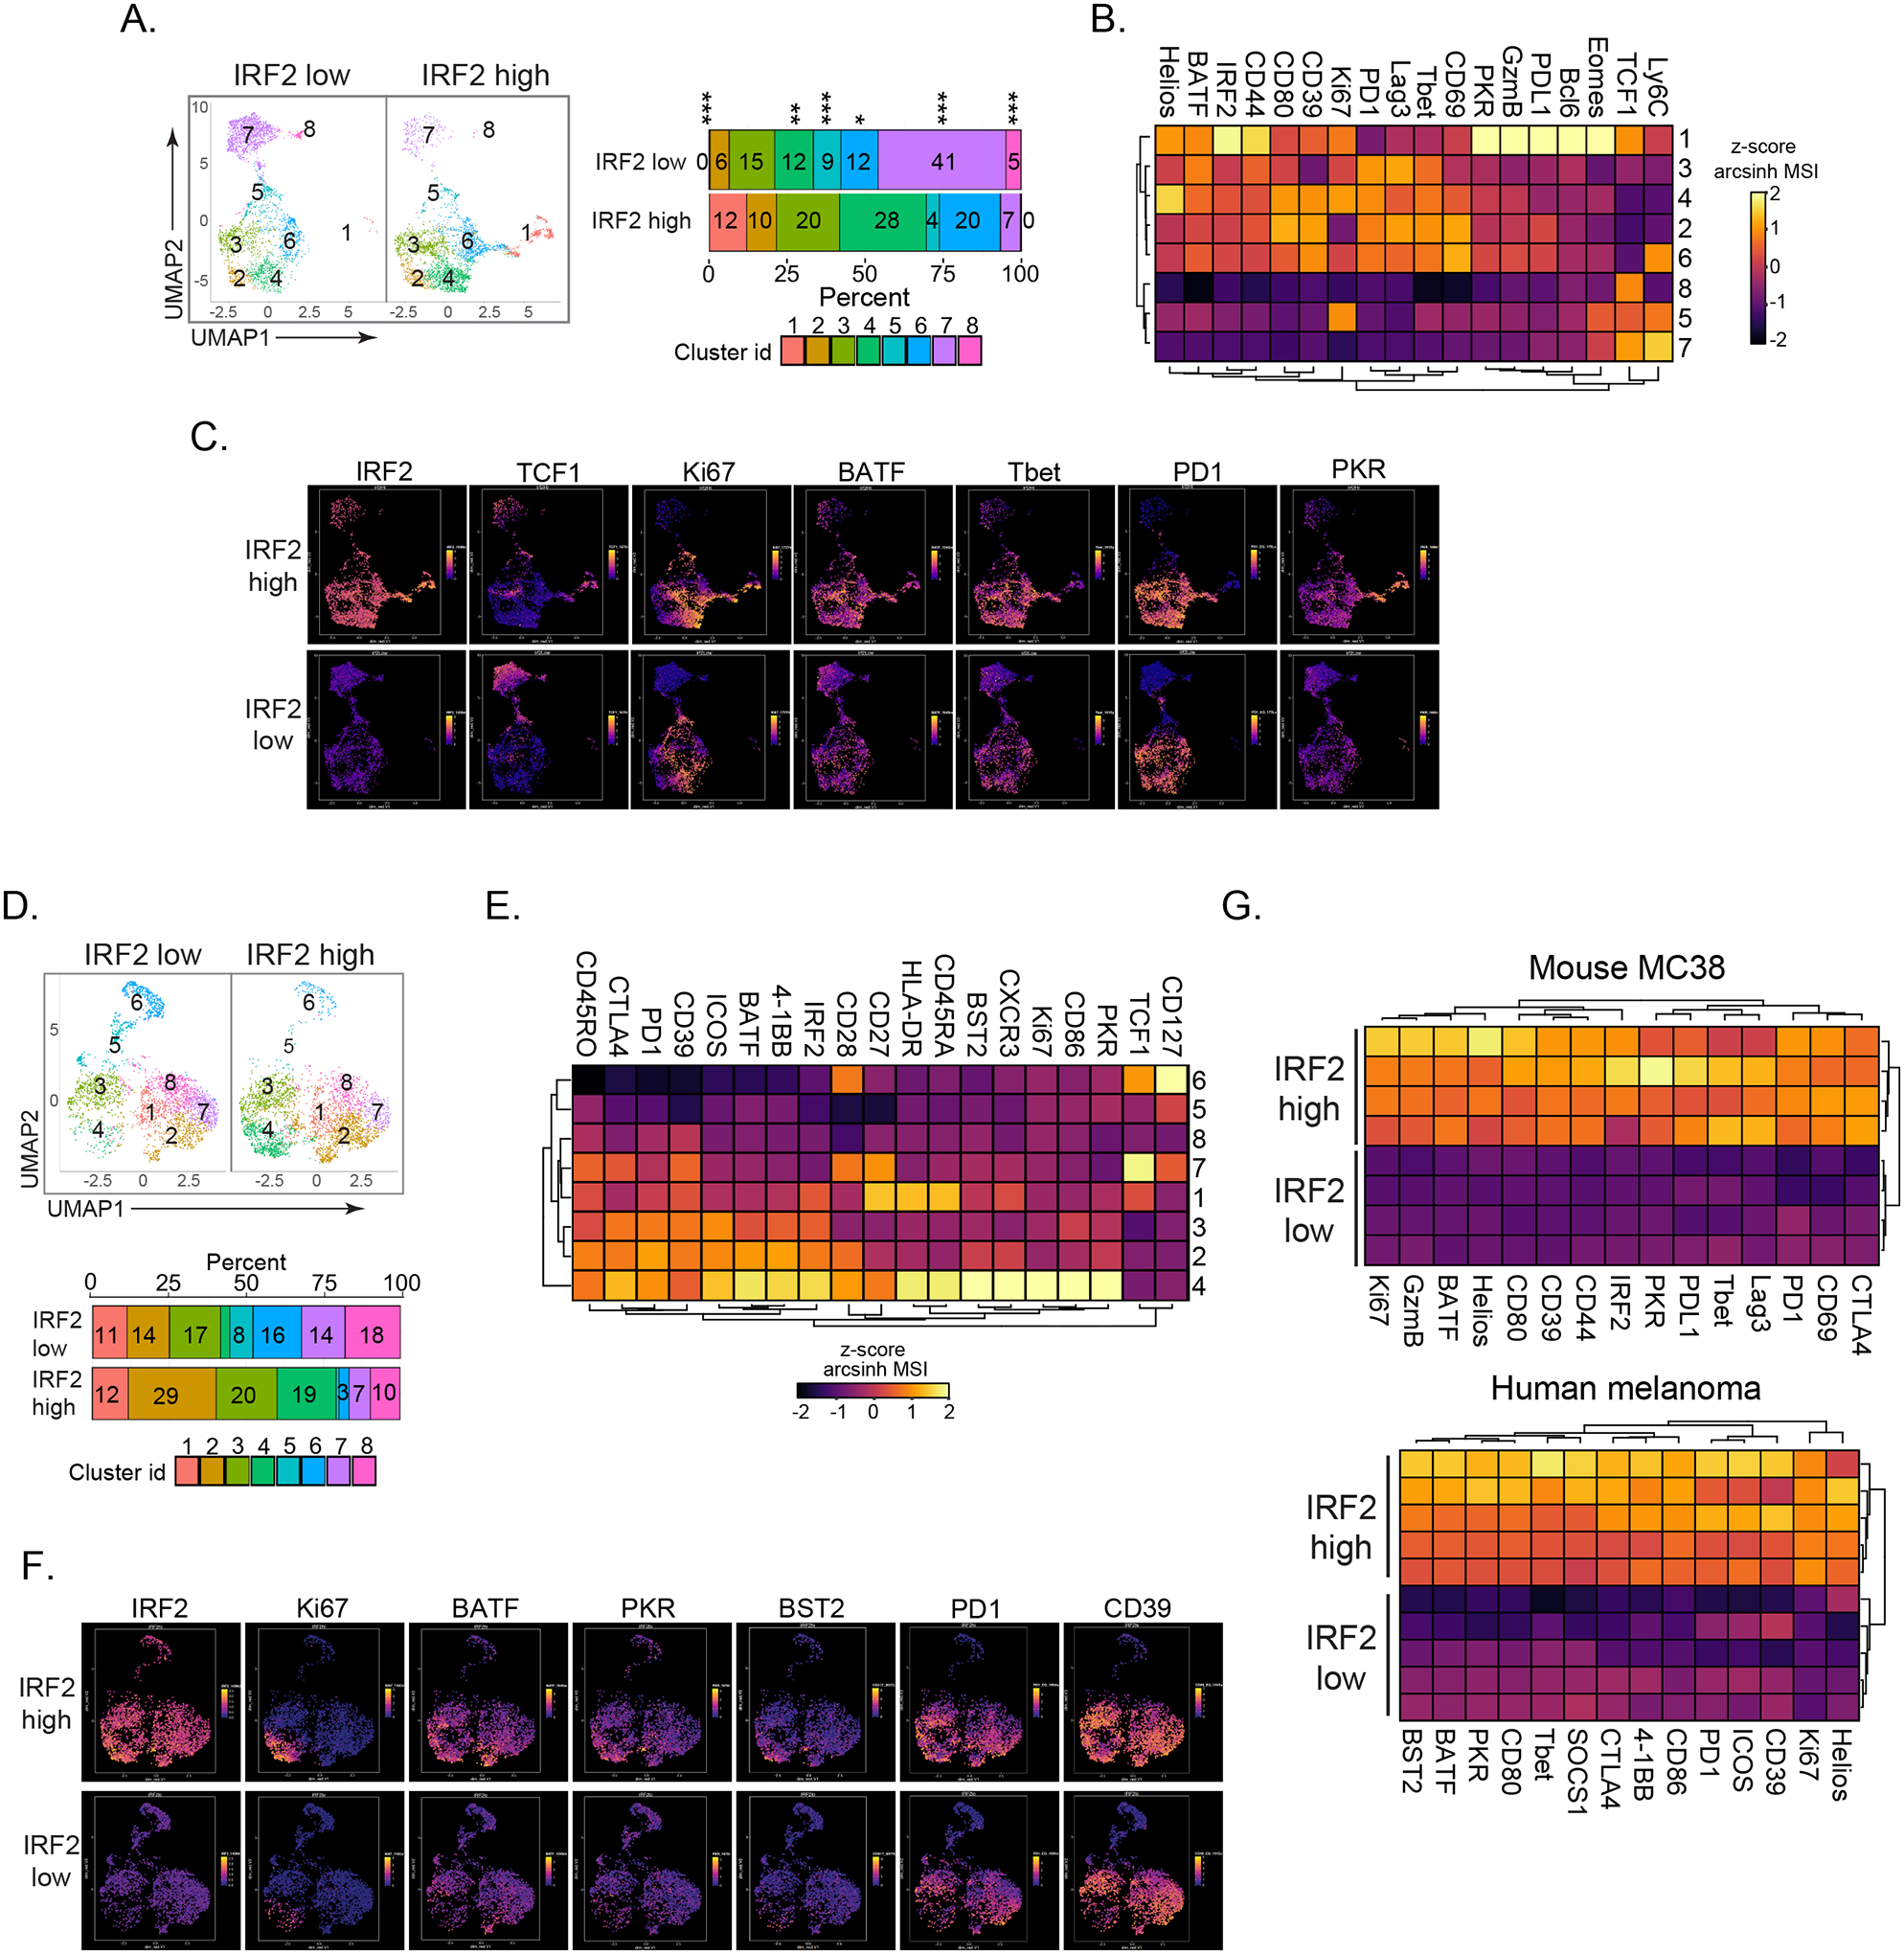
IRF2 is highly expressed in activated and ISG-producing mouse and human CD8+ TILs.
CD8+ TILs were divided into IRF2 high (upper 30%) and low (lower 30%) levels of IRF2 expression.
(A) PhenoGraph-defined clusters divided into IRF2 high and IRF2 low CD8+ T cells from mouse MC38 tumors (day 14). Bar graph depicts the proportion of each cluster in their respective groups.
(B) Heatmap represents expression of the indicated protein in each cluster.
(C) Expression and distribution of the indicated protein in the IRF2 high and low clusters of MC38-infiltrating CD8+ T cells.
(D-F) IRF2 distribution in human melanoma tissue biopsies.
(D) CD8+ TILs were divided into IRF2 high and low fractions and then clustered as in panel A. Shown is one representative tumor. Bar graph depicts the proportion of each cluster in their respective groups.
(E) Heatmap represents expression of the indicated protein in each cluster.
(F) Expression and distribution of the indicated protein in the IRF2 high and low clusters of CD8+ TILs.
(G) Heatmaps compare arcsinh transformed z-score of the MSI of the indicated protein in the IRF2 high and low CD8+ TILs in mouse MC38 tumors (top) and human melanoma (bottom). Each row represents CD8+ T cells from a different tumor.
The mouse MC38 data are representative of 3 independent experiments, each with at least 4 mice. * p<0.05, ** p<0.01, *** p< 0.0001. Unpaired, two-tailed Student’s t-test used to analyze significance of cluster proportions between IRF2 high and IRF2 low groups.
