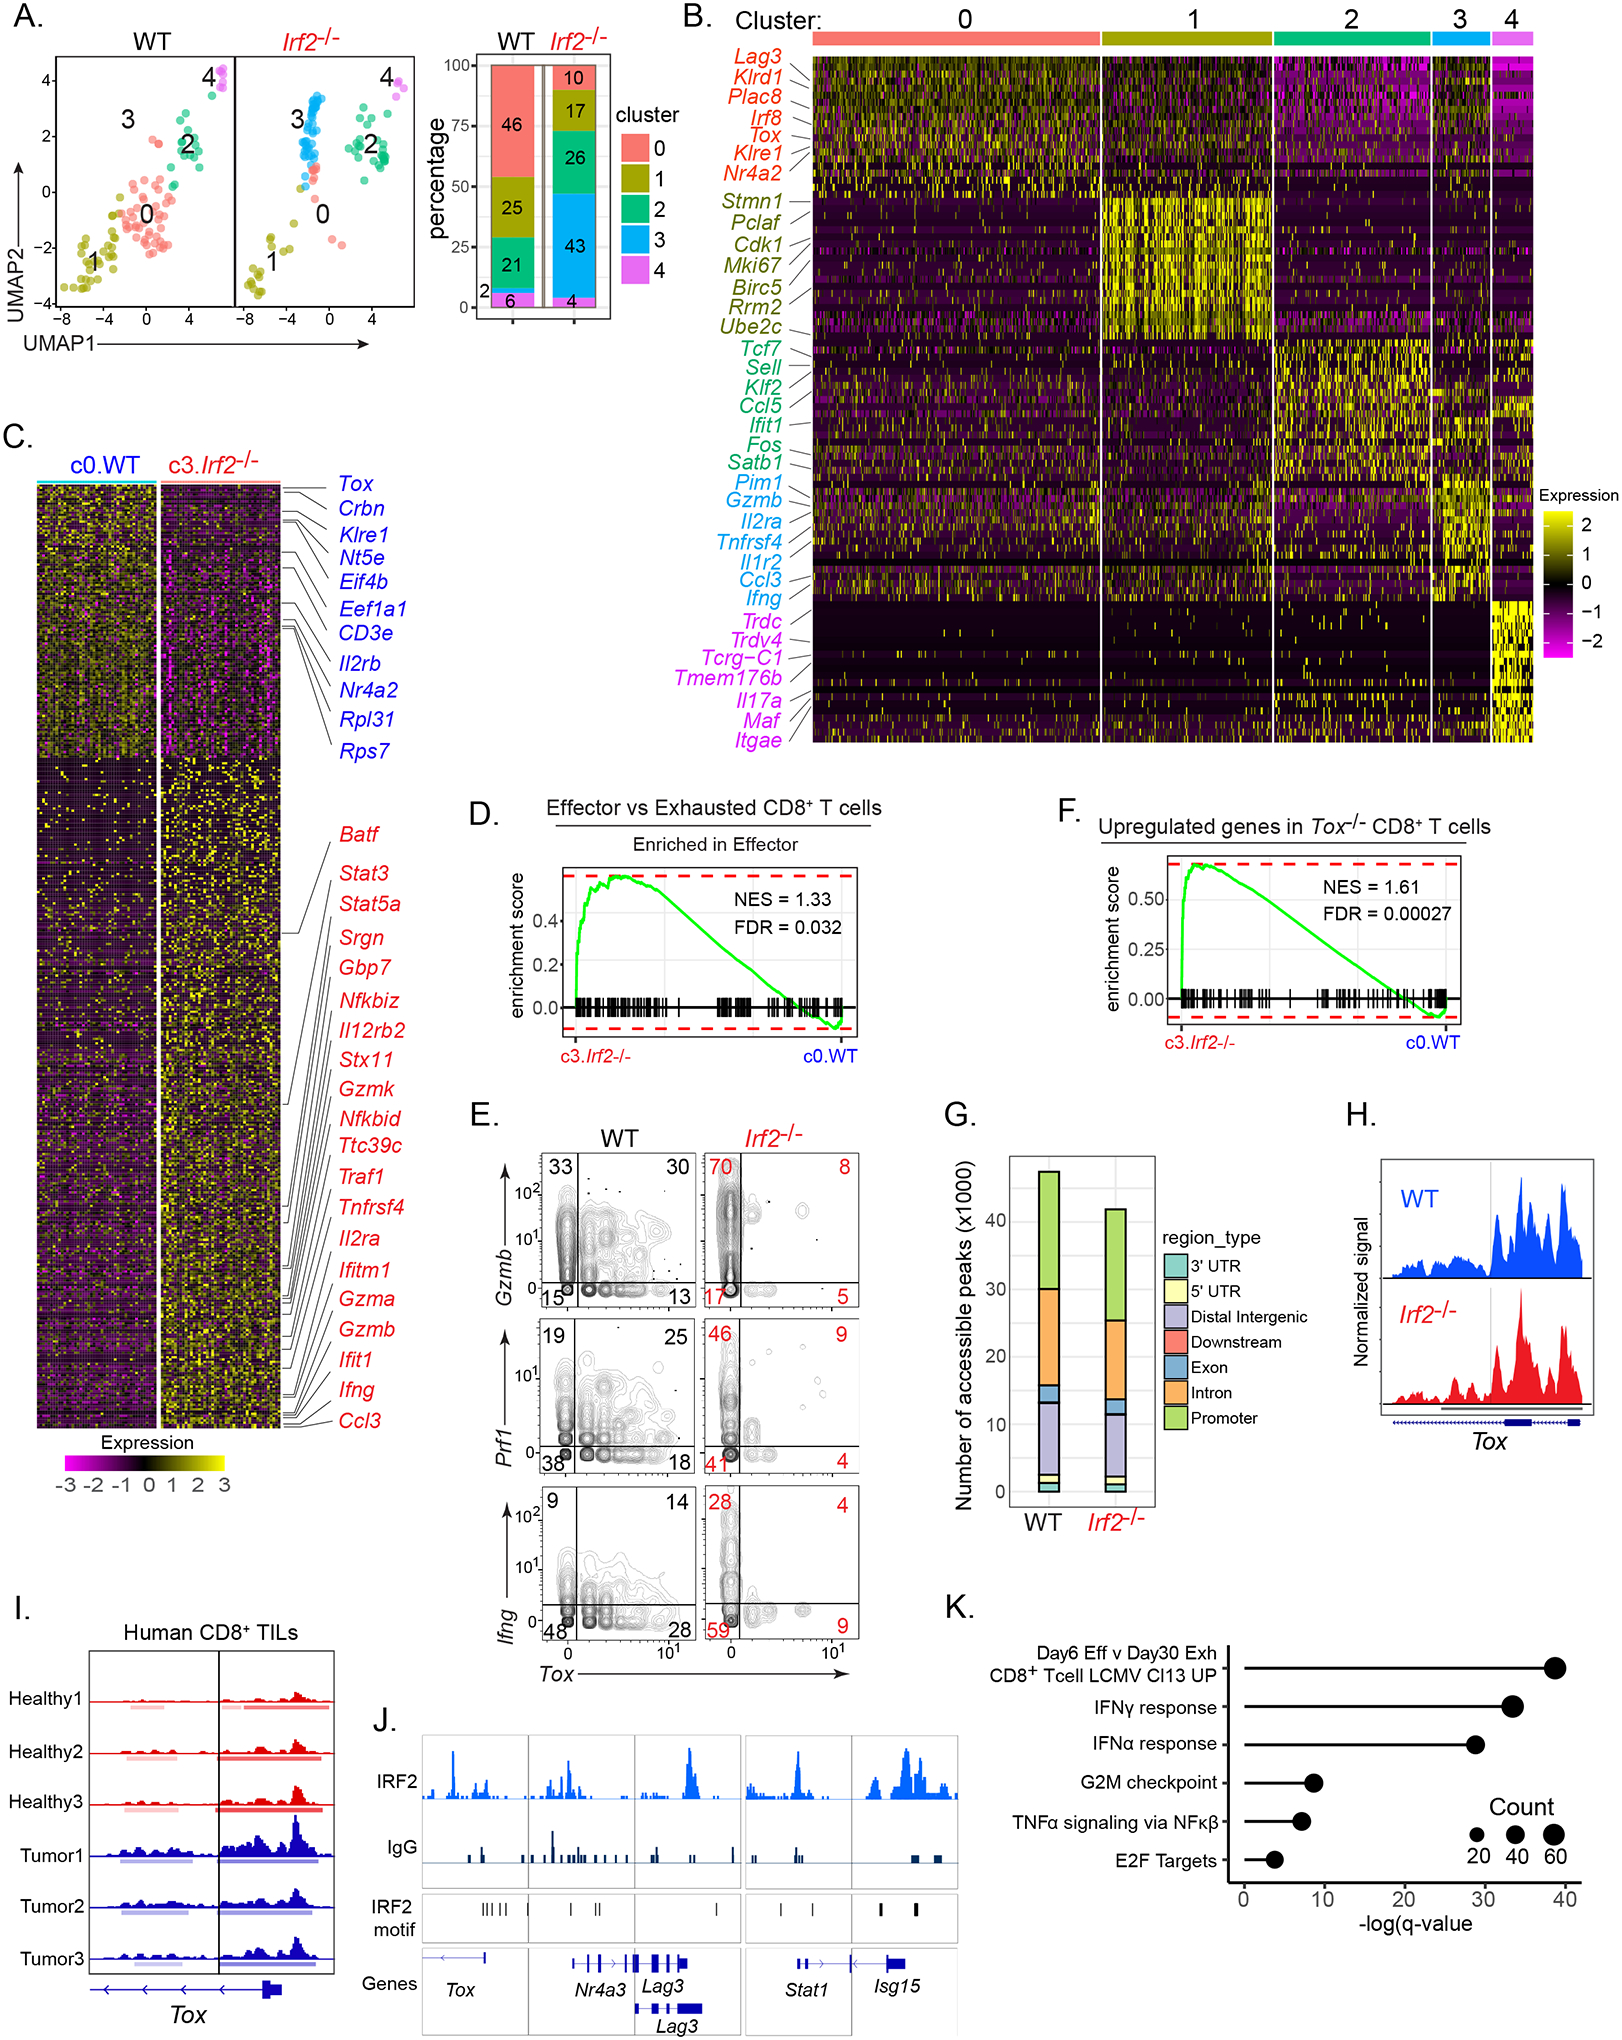
Figure 5: Transcriptional, epigenetic and gene-binding profiling.

(A) WT and Irf2−/−CD8+ TILs derived from scRNA-seq data and clustered using Seurat. Bar graph depicts the proportion of each cluster within their respective group.
(B) Heatmap of top 20 up-regulated genes defining the clusters.
(C) Heatmap of differentially expressed genes between WT cluster 0 (c0.WT) and Irf2−/− cluster 3 (c3.Irf2−/−).
(D) GSEA plot showing enrichment of c0.WT and c3.Irf2−/− CD8+ T cells in gene signatures of effector vs exhausted CD8+ T cell pathway (from ImmuneSigDB).
(E) 2D plots showing Gzmb, Ifng, Prf1 and Tox RNA expression by WT and Irf2−/−CD8+ TILs.
(F) GSEA plot showing enrichment of c3.Irf2−/− CD8+ T cells in the gene signature of Tox-deficient CD8+ T cells, from (Khan et al., 2019).
(G) scATAC-seq analysis indicating the number of accessible peaks in each region of WT and Irf2−/−CD8+ TILs.
(H) Open chromatin state at IRF2-binding sites in the Tox promoter of WT (blue) and Irf2−/− (red) CD8+ TILs. Solid vertical line represents predicted IRF2 motif with a p<0.00005.
(I) ATAC-seq plot indicating open chromatin state at IRF2-binding sites in the Tox promoter of CD8+ T cells isolated from peripheral blood lymphocytes obtained from (red peaks) three healthy donors; and (blue peaks) PD1hi CD8+ TILs from 2 melanoma patients (tumor 1 and 2) and 1 lung cancer patient (tumor 3). Solid vertical lines represent predicted IRF2 motifs with a p<0.00005.
(J) Representative alignments of CUT&Tag peaks depicting IRF2 and IgG control antibody binding to the indicated loci of in vitro activated CD8+ T cells from the spleen and lymph nodes of WT mice.
(K) Selective list of pathways (and their respective adjusted P value) based on the genes that interact with IRF2. The size of each dot indicates the number of genes in that pathway.
