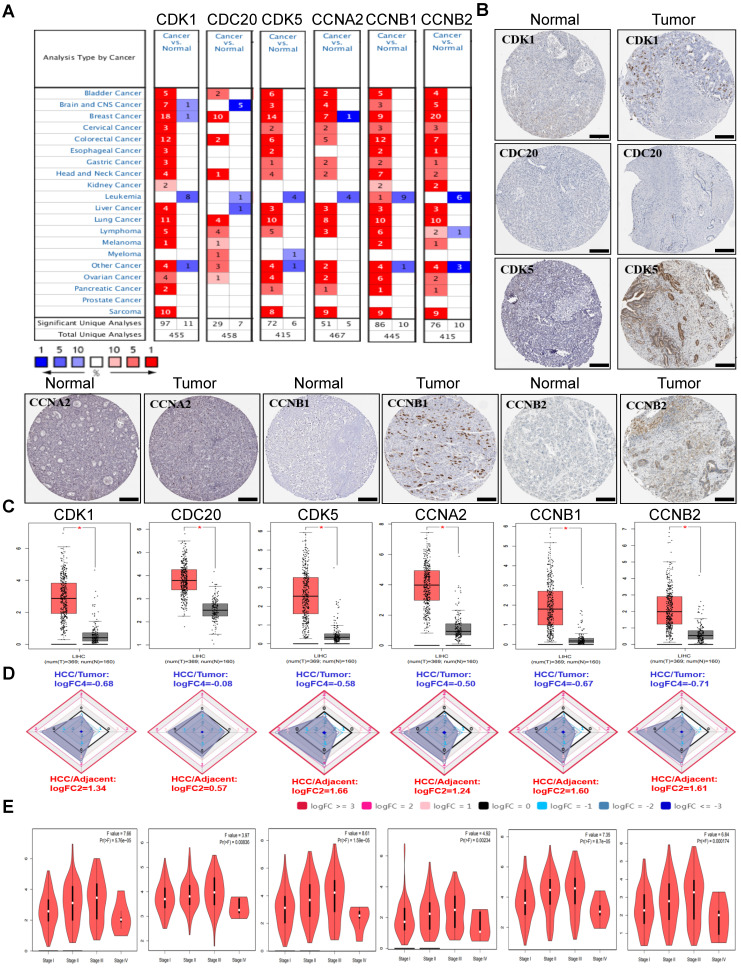
Figure 1.
The expression levels of CDK1, CDK5, CDC20, CCNA2, CCNB1 and CCNB2 in HCC. (A) Transcriptional pattern of CDK1, CDK5, CDC20, CCNA2, CCNB1 and CCNB2 in major malignant tumors compared with those in normal tissues using the Oncomine database. The heat-map represents data with statistically significant upregulation (red) or downregulation (blue). The numbers in the heat-map indicate the published independent datasets of mRNA microarray experiments. (B) The protein expression levels of CDK1, CDK5, CDC20, CCNA2, CCNB1 and CCNB2 in HCC from HPA. Scale bar: 200μm. (C) The mRNA expression levels of CDK1, CDK5, CDC20, CCNA2, CCNB1 and CCNB2 in GEPIA. (*P < 0.05). (D) The mRNA expression levels of CDK1, CDK5, CDC20, CCNA2, CCNB1 and CCNB2 compared with the normal tissues in HCCDB. (E) Correlation of the CDK1, CDK5, CDC20, CCNA2, CCNB1 and CCNB2 expression levels with various tumor stages among HCC tissues in GEPIA.

