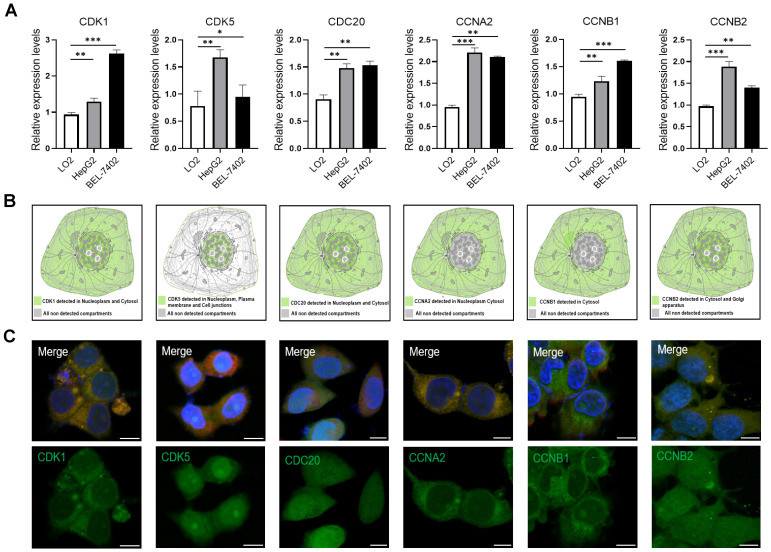
Figure 2.
(A) The expression of CDK1, CDK5, CDC20, CCNA2, CCNB1 and CCNB2 in HepG2 and BEL-7402 cells compared with LO2 cells by quantitative PCR analysis. *p <0.05, **p <0.01, ***p <0.001; n = 3. (B) The subcellular localization of the six-cell cycle related protein analyzed in HPA database. (C) Immunofluorescence images of CDK1, CDK5, CDC20, CCNA2, CCNB1 and CCNB2 in HepG2 cells. The nucleuses were stained blue, the microtubules were stained red, and the cell cycle related proteins were stained green. Scale bar = 10μm.

