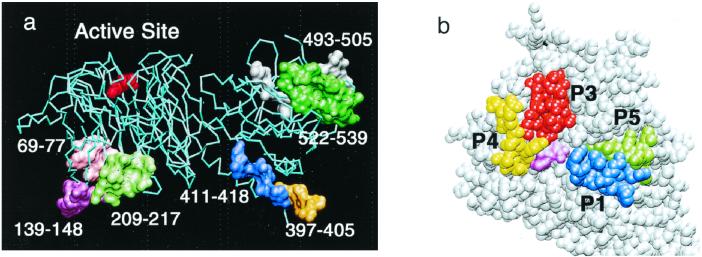
FIG. 3.
(a) Overall view of the 3D structure model of TcTS showing the distribution of putative epitopes as identified by screening a phage library of peptides. A sialic acid residue placed in the catalytic site is indicated in red. (b) Close view of the TcTS active-site cleft showing selected peptide sequences for SPOT epitope analysis. Peptide 1 is shown in blue, peptide 3 is in red, peptide 4 is in yellow, and peptide 5 is in green. A sialic acid residue placed in the catalytic site is in light purple.

