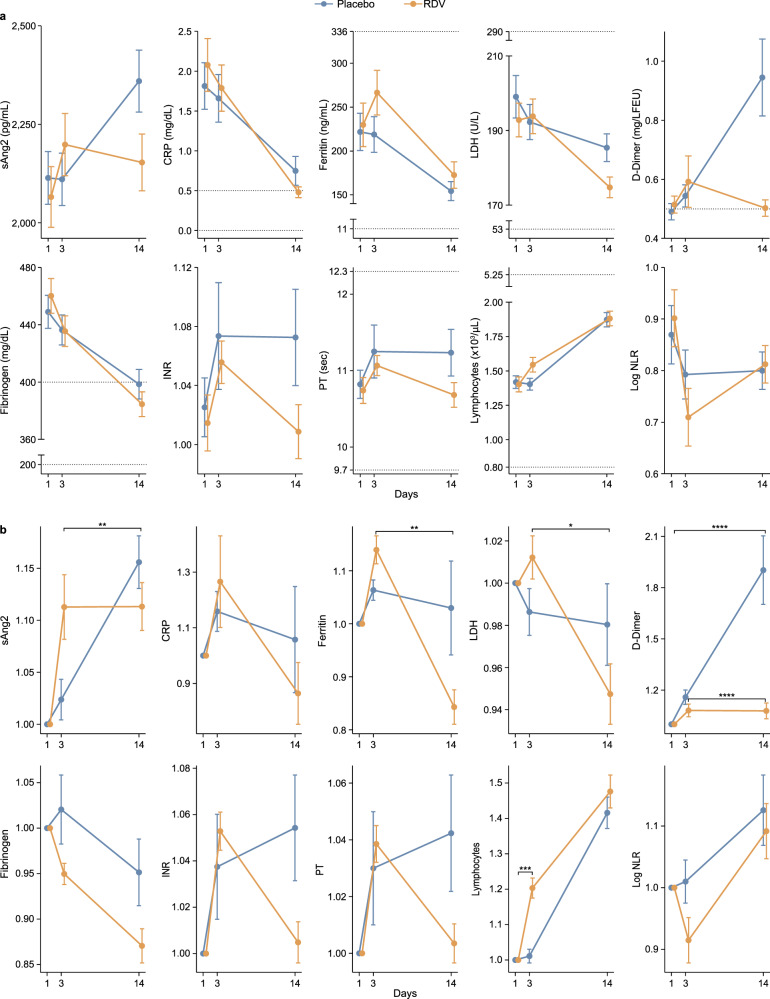
Fig. 2. Longitudinal changes in inflammation, coagulation, and hematologic biomarkers in remdesivir- vs. placebo-treated patients.
Linear mixed effects model (LMM) used to test differences between day 3 and baseline (day 1), day 14 and day 3, and day 14 and baseline between remdesivir (RDV)- and placebo-treated patients. a Longitudinal plots of biomarker absolute value changes (mean with standard error) in RDV- (yellow) vs. placebo-treated (blue) patients. Dashed lines indicate normal ranges or expected values in healthy individuals. b Longitudinal plots of fold change (mean with standard error) in biomarkers in RDV- (yellow) vs placebo-treated (blue) patients. *FDR < 0.05, **FDR < 0.01, ***FDR < 0.001, ****FDR < 0.0001. Significance is determined by the LMM. The number of patients used in the LMM for each biomarker is provided Supplementary Data 1.

