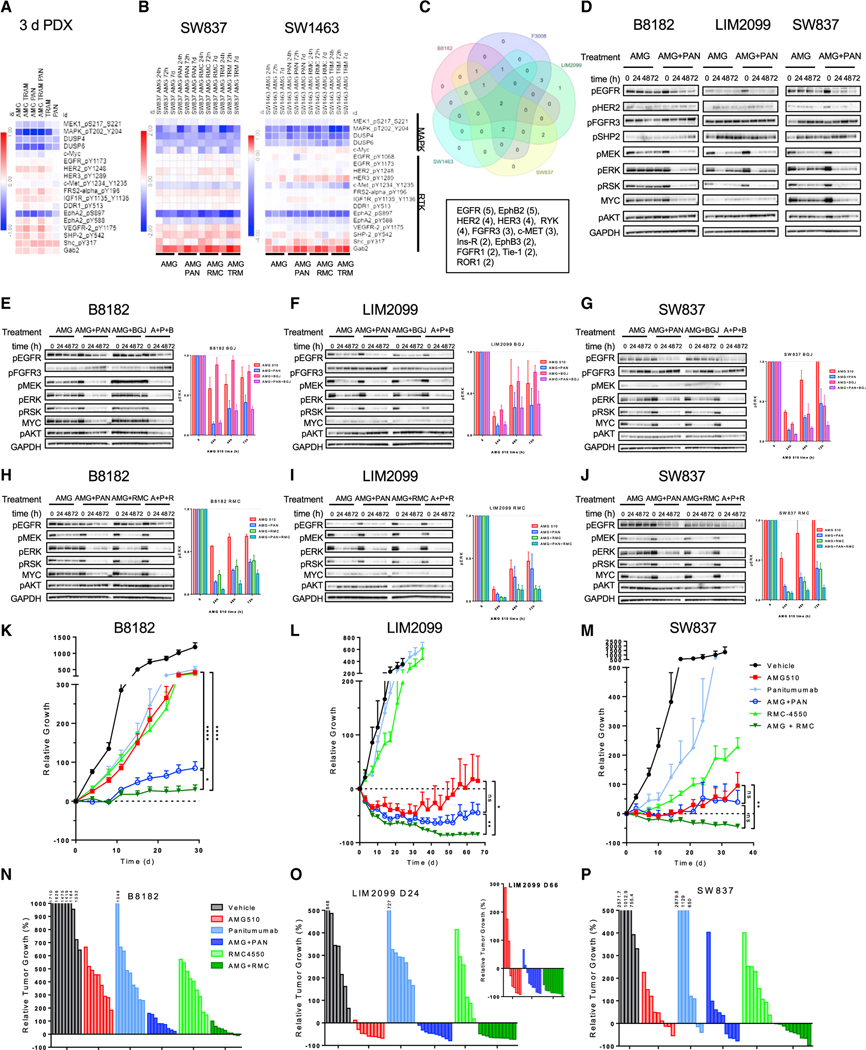
Figure 5. Heterogeneous RTK expression limits the durability of EGFR treatment in KRASG12C, and SHP2 inhibition leads to deeper more durable response in vivo.
(A) Combined RPPA analysis of KRASG12C CRC PDX tumors treated with AMG 510 (100 mg/kg), panitumumab (0.5 mg), or trametinib (1 mg/kg) alone or in combination for 3 days.
(B) RPPA analysis of SW837 and SW1463 cell lines treated with the indicated inhibitors for 24 h, 72 h, or 7 days.
(C) RTK array expression analysis of CRC cell lines in Figures S5A and S5B.
(D) B8182, LIM2099, and SW837 cell lines were treated with AMG 510 alone or in combination with panitumumab for 24, 48, or 72 h. Blot analysis was performed for pEGFR, pHER2, pFGFR3, pSHP2, pMEK, pERK, pRSK, pAKT, and total MYC with GAPDH as a loading control.
(E–G) B8182, LIM2099, and SW827 cell lines were treated with AMG 510 alone or in combination with panitumumab or the FGFR inhibitor BGJ398 (1 μM), and densitometry analysis was performed for pERK normalized to GAPDH.
(H–J) B8182, LIM2099, and SW827 cell lines were treated with AMG 510 alone or in combination with panitumumab or RMC-4550, and densitometry analysis was performed for pERK normalized to GAPDH.
(K–M) B8182 PDX, LIM2099, and SW837 xenograft models were treated daily with AMG 510 (100 mg/kg) or RMC-4550 (30 mg/kg) or twice weekly with panitumumab (0.5 mg/kg) alone or in combination for 28, 66, and 35 days, respectively.
(N–P) Waterfall plots of endpoint tumors in xenograft models in (K)–(M).
Statistical significance was evaluated by Mann-Whitney test, where *p < 0.05, **p < 0.01, and ****p < 0.0001.

