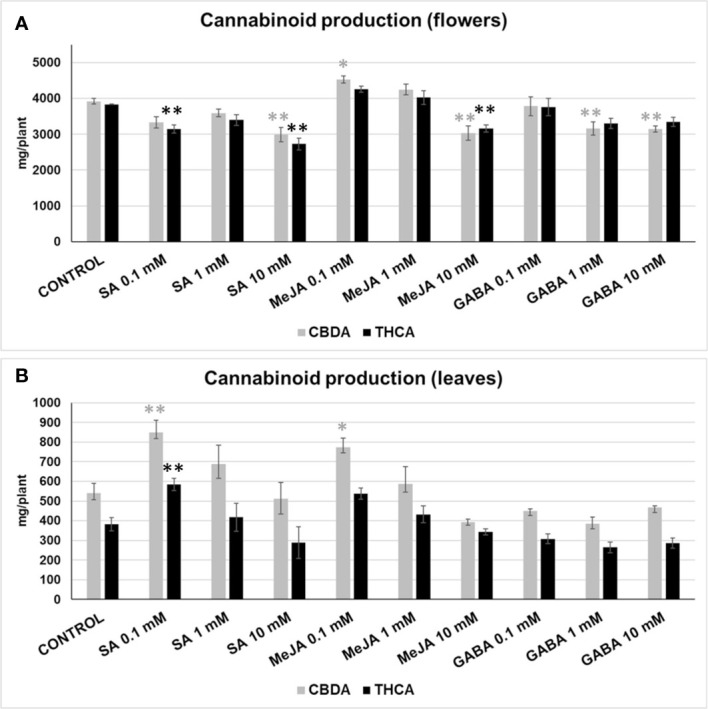
Figure 3.

CBDA (grey) and THCA (black) produced in inflorescences (A), and leaves (B) by plants subjected to different treatments, expressed in mg per plant. Mean ± standard error is represented. Within each cannabinoid, asterisks indicate significant differences with control plants (one-way ANOVA test, followed by two-tailed Dunnett’s test, **p < 0.05, *p < 0.1).
