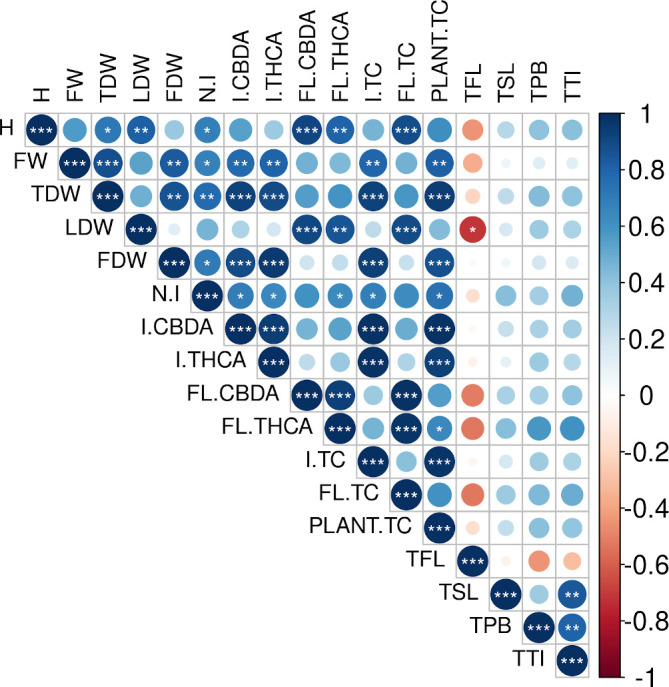
Figure 5.

Correlogram depicting Pearson´s correlation matrices between plant growth parameters and cannabinoid yields. Correlation coefficients are proportional to the dot area and color. Correlation p-value is indicated by asterisks (*, p < 0.05; **, p < 0.01; ***, p < 0.001). H, height increment; FW, fresh weight; TDW, total dry weight; LDW, leaves dry weight; FDW, total inflorescences dry weight; N.I, total number of inflorescences; I.CBDA, CBDA content in inflorescences; I.THCA, THCA content in inflorescences; FL.CBDA, CBDA content in fan leaves; FL.THCA, THCA content in fan leaves; I.TC, total cannabinoid content in inflorescences; FL.TC, total cannabinoid content in fan leaves; Plant.TC, plant total cannabinoid content; TFL, trichome density in fan leaves; TSL, trichome density in sugar leaves; TPB, trichome density in perigonal bracts; TTI, total trichome density in inflorescences.
