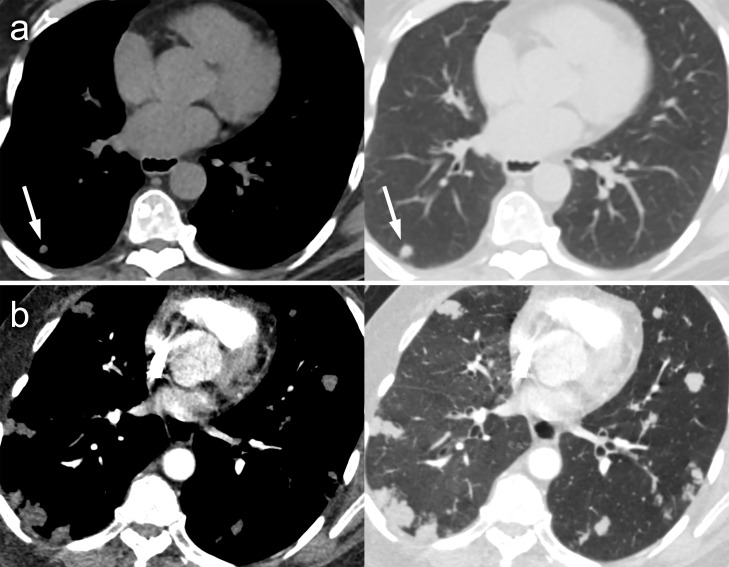
Figure 3.
Axial CT images on soft-tissue and lung window settings demonstrating one of several small low-density pulmonary nodules within the right lower lobe on the CT component of a non-contrast PET-CT (arrowed) with a tiny focus of low density to its left side which may represent macroscopic fat (A). There is evidence of marked disease progression on subsequent CTPA performed 11 months later, with significant increase of the index nodule and several new lesions (B). CTPA, CT pulmonary angiography; PET, positron emission tomography.

