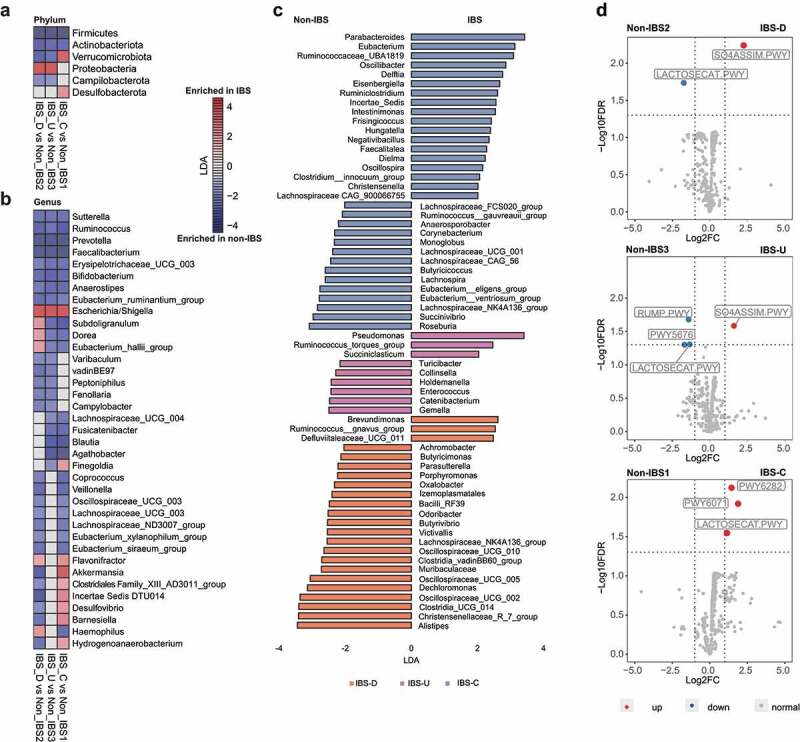
Figure 2.

Compositional and functional alterations in gut microbiota of patients with different IBS subtypes. (a) The alterations of six phyla in different IBS subtypes by comparing to corresponding non-IBS control; (b) The alterations of 37 genera in different IBS subtypes by comparing to corresponding non-IBS control; (c) 64 microbial genera that only altered in one specific IBS subtype. The alteration was assessed by comparing IBS cohort and non-IBS cohort for each subtype using the linear discriminative analysis (LDA) effect size biomarker discovery tool (p < .05, LDA >2, FDR<0.1). (d) Volcano plots demonstrating bacterial MetaCyc pathway alterations in IBS-D, IBS-U and IBS-C; A binomial test was used to calculate the p values for the up-regulation or down-regulation of MetaCyc pathway in the IBS cohort versus the non-IBS cohort for each subtype. Colored dot indicate pathway with FDR- adjusted p < .05.
