
Figure 2.
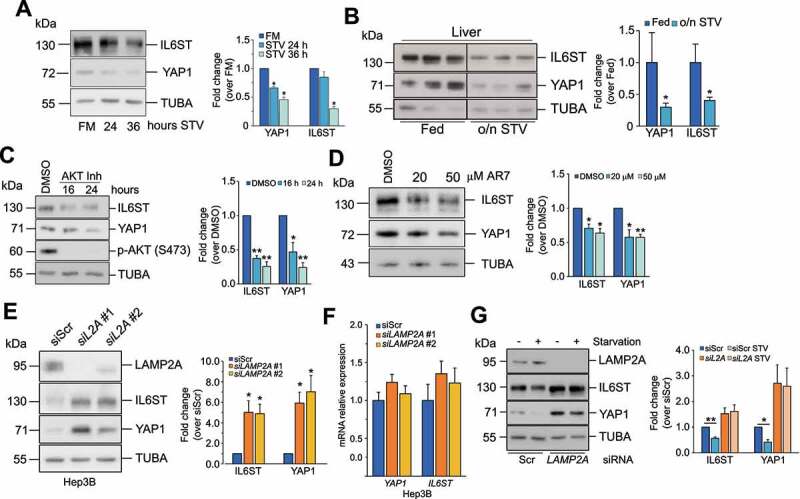
Modulation of CMA influences YAP1 and IL6ST protein levels. (A) Prolonged starvation reduces protein levels of YAP1 and IL6ST in Hep3B cells. The panel on the right shows the fold change of YAP1 and IL6ST over their expression in cells grown in FM, set as 1. (B) Overnight starvation reduces protein levels of YAP1 and IL6ST in mouse livers. The panel on the right shows the fold change of YAP1 and IL6ST over their expression in fed mice; lane 1 was set as 1. (C) Treatment of Hep3B cells with 10 μM of AKT inhibitor decreases YAP1 and IL6ST levels. The panel on the right shows the fold change of YAP1 and IL6ST over their expression in cells treated with DMSO, set as 1. (D) Treatment of Hep3B for 24 h with the indicated concentrations of the atypical RARA receptor antagonist AR7 decreases YAP1 and IL6ST levels. The panel on the right shows the fold change of YAP1 and IL6ST over their expression in cells treated with DMSO, set as 1. (E) Silencing of LAMP2A causes the accumulation of YAP1 and IL6ST in Hep3B cells. The panel on the right shows the fold change of YAP1 and IL6ST over their expression in cells transfected with siScr, set as 1. (F) Silencing of LAMP2A has no effect on the mRNA levels of YAP1 and IL6ST. Data are plotted as the mean ± SEM of n = 3 biological replicates. ACTB was used as a housekeeping gene. (G) Silencing of LAMP2A prevents starvation-induced YAP1 and IL6ST degradation. Cells were cultured without serum for 24 h. The panel on the right shows the fold change of YAP1 and IL6ST over their expression in cells transfected with siScr, set as 1. The intensity of the bands of interest was normalized to TUBA (panels A-E and G), prior to fold-change calculations. Data are plotted as the mean ± SEM of n = 3 biological replicates. *p < 0.05, **p < 0.01 vs control.