
Figure 1.
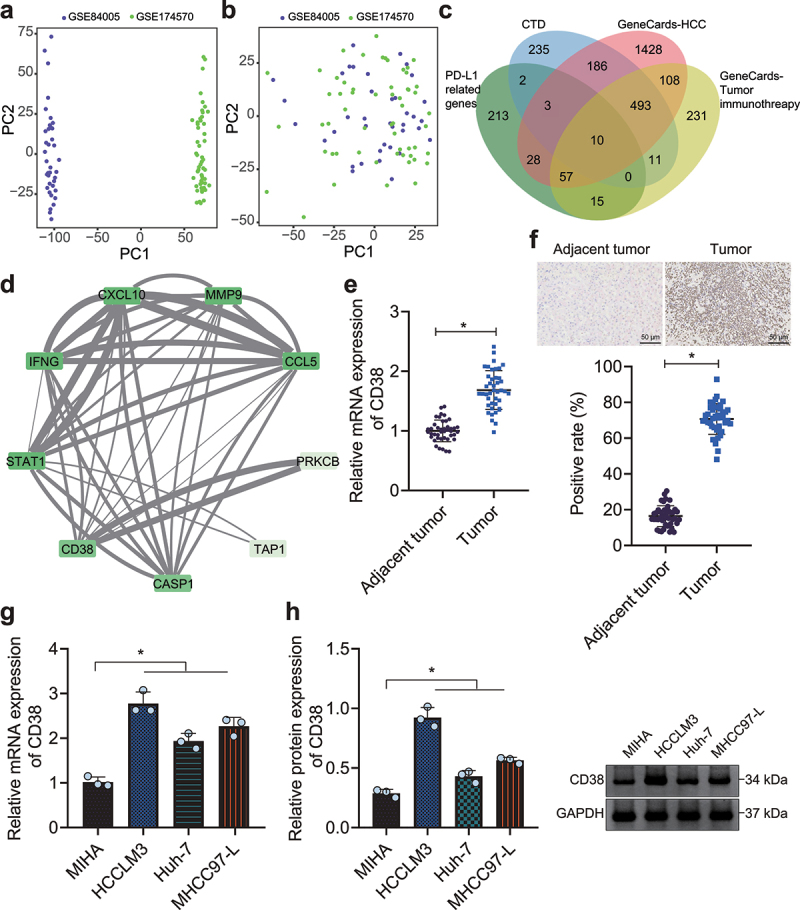
Amplified expression of CD38 expression in HCC. A, Data distribution of 2 expression profile datasets before the removal of batch effect. B, Data distribution of 2 expression profile datasets after the removal of batch effect. C, Venn diagram displaying the interaction of correlation analysis and screening results. D, Protein–protein interaction (PPI) analysis of candidate genes. Degree value indicates the number of PPI and decreases anticlockwise. The darker color represents higher Degree value. Combined score indicates the score of PPI. The thicker line represents larger Combined score. E, Expression of CD38 in HCC and adjacent normal tissues (n = 42) determined by RT-qPCR. F, Expression of CD38 in HCC and adjacent normal tissues (n = 42) determined by IHC, scale bar: 50 μm. G, mRNA expression of CD38 in HCC cells (HCCLM3, Huh-7 and MHCC97-L) and human normal hepatocytes (MIHA) determined by RT-qPCR. H, Protein expression of CD38 in HCC cells (HCCLM3, Huh-7 and MHCC97-L) and human normal hepatocytes (MIHA) determined by Western blot analysis. * p < .05. The data in the figure are all measurement data, and expressed as mean ± standard deviation. Comparison of adjacent normal tissues and HCC tissues was conducted by paired t test, and the comparison among multiple groups by one-way ANOVA. Cell experiments were repeated three times independently.