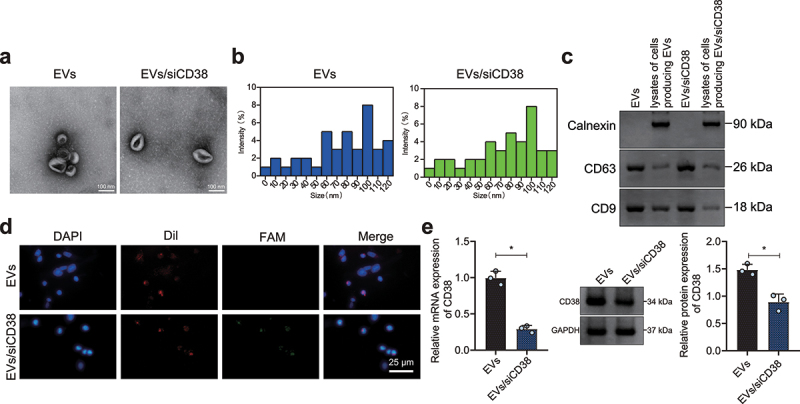
Figure 3.

Characterization of EVs/siCD38. A, TEM observation of the morphology of EVs and EVs/siCD38 (100 nm). B, NTA determination of the size distribution of EVs and EVs/siCD38. The blue line represents EVs, and the green line represents EVs/siCD38. C, Western blot analysis of CD63, CD9 and calnexin proteins in the EVs and EVs/siCD38. D, Uptake of EVs/siCD38 by HCCLM3 cells measured by a laser confocal microscope, scale bar: 25 μm. Red fluorescence represents the Dil-labeled EVs, green fluorescence represents FAM-labeled siCD38, and blue fluorescence represents DAPI-labeled nuclei. E, CD38 expression determined in HCCLM3 cells treated with EVs/siCD38 by RT-qPCR and Western blot analysis. * p < .05. The data in the figure are all measurement data, and are expressed as mean ± standard deviation. Comparison of data in two groups was conducted by independent sample t test. Cell experiments were repeated three times independently.
