
Figure 3.
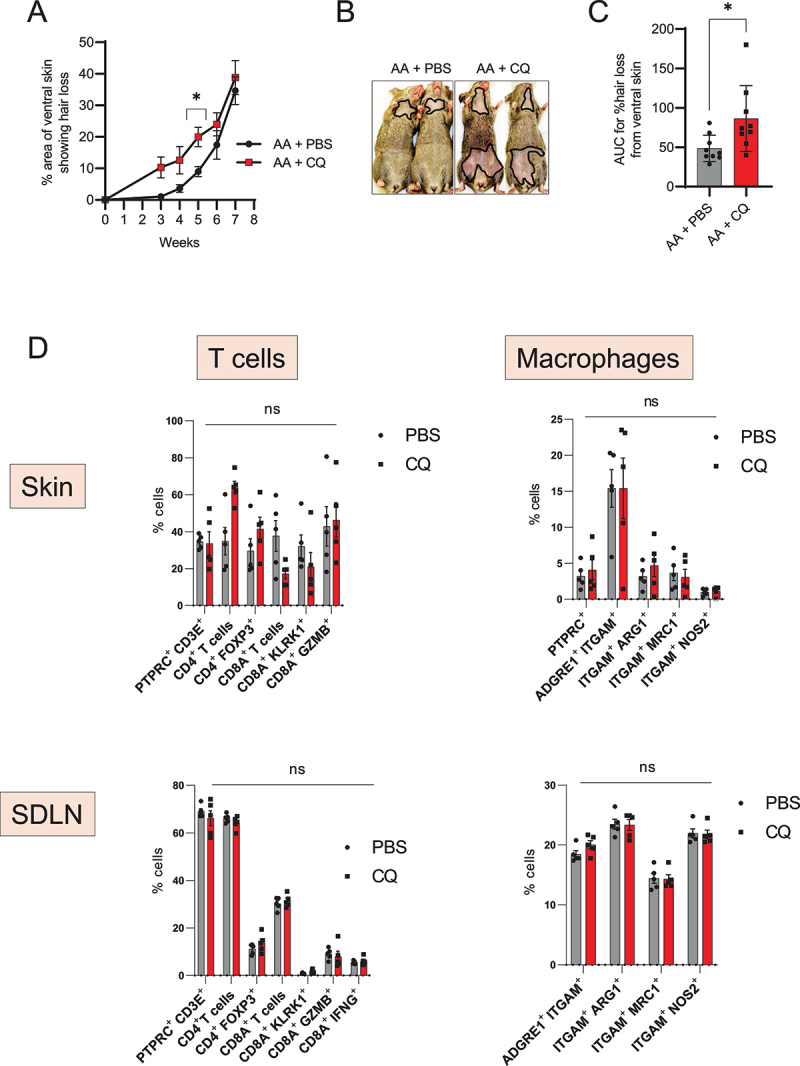
Autophagy blocker chloroquine accelerates disease onset in AA mice. (A) Graph shows the quantification of the % area of skin showing hair loss in CQ, or PBS treated AA mice. CQ treated mice had a significantly larger area of skin showing hair loss at 5 weeks after grafting. Data were pooled from 3 independent experiments with 3 mice per group. Two-way ANOVA was used to analyze data. *p < 0.05 was considered significant. (B) Images show the extent of disease in grafted AA mice upon treatment with CQ or PBS vehicle. Solid black line demarcates the area of skin without hair shafts. (C) Graph shows AUC measurement for % area of skin showing hair loss upon CQ or PBS treatment over weeks after grafting. Unpaired two-tailed t-test was used to analyze data. *p-values <0.05 was considered significant. (D) Graphs show the frequency of various T cells and macrophage subsets in the skin and skin-draining lymph nodes (SDLN) of PBS or CQ treated AA mice. 5 mice were used per treatment group. Two-way ANOVA statistical test was performed and p < 0.05 were considered statistically significant. Differences between groups were not-significant (ns).