Figure 6.

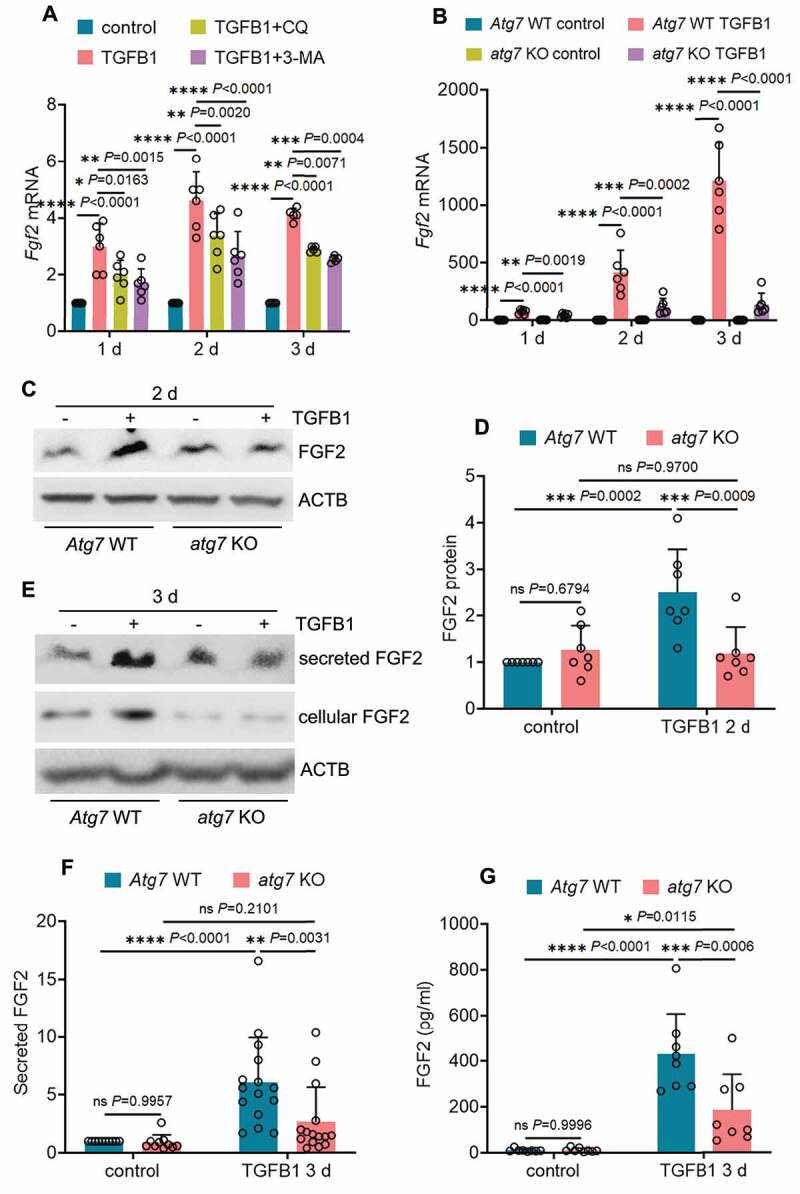
Autophagy inhibition reduces the production and secretion of FGF2 in renal proximal tubular cells during TGFB1 treatment. (A) Subconfluent BUMPT cells were exposed to 5 ng/ml TGFB1 in serum-free DMEM for up to 3 days alone or with 2 µM CQ or 1 mM 3-MA. Control cells were kept in serum-free medium without TGFB1. Cells were collected at the indicated time points for RT-qPCR assay of Fgf2 mRNA (n = 6 experiments). (B) Subconfluent WT and atg7 KO mouse proximal tubular cells were exposed to 5 ng/ml TGFB1 in serum-free DMEM for up to 3 days. Control cells were kept in serum-free medium without TGFB1. Cells were collected at the indicated time points for RT-qPCR assay of Fgf2 mRNA (n = 6 experiments). (C and D) Subconfluent WT and atg7 KO mouse proximal tubular cells were exposed to 5 ng/ml TGFB1 in serum-free DMEM for 2 days. Control cells were kept in serum-free medium without TGFB1. Cell lysates were collected for FGF2 immunoblot and densitometry (n = 7 experiments). (E) Subconfluent WT and atg7 KO mouse proximal tubular cells were exposed to 5 ng/ml TGFB1 in serum-free DMEM for 3 days. Control cells were kept in serum-free medium without TGFB1. Both cell lysates and culture media were collected for immunoblots of cellular and secreted FGF2 (n = 10 experiments). (F) Densitometry of secreted FGF2 protein. (G) Cells and treatments were described in (E). Culture media were collected for FGF2 ELISA (n = 6 experiments). Data in (A, B, D, F and G) are presented as mean ± SD. Two-way ANOVA with multiple comparisons was used for statistics.
