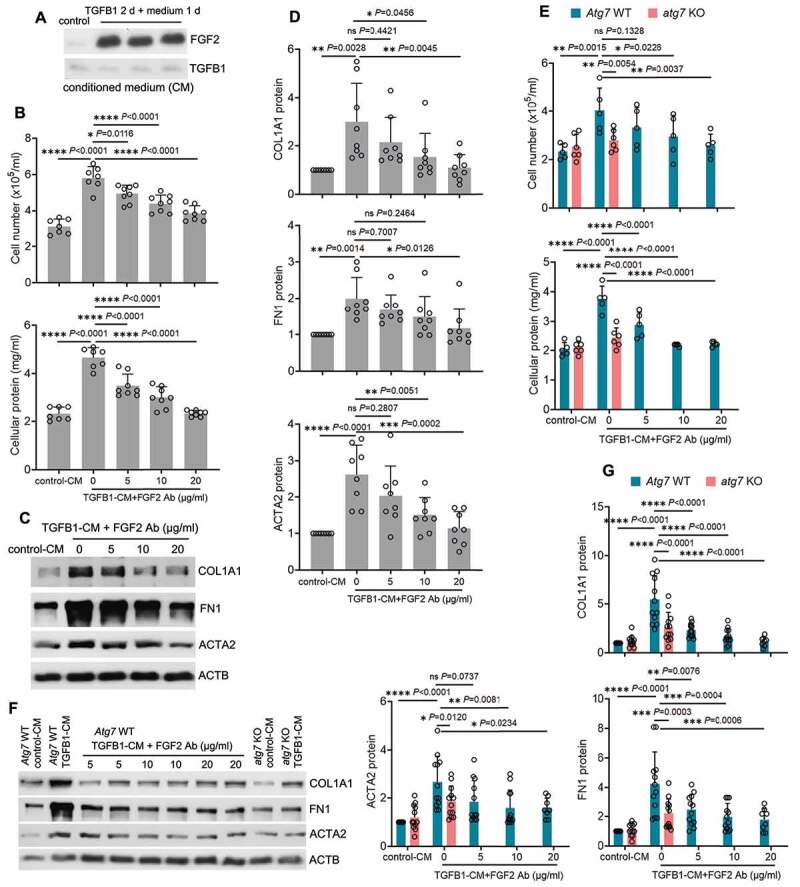
Figure 7.

FGF2 neutralizing antibody attenuates the paracrine effect of renal tubular cells on fibroblasts. (A) Subconfluent BUMPT cells were exposed to 5 ng/ml TGFB1 in serum-free DMEM for 2 days. Control cells were kept in serum-free medium without TGFB1. The old culture media for both TGFB1-treated and control cells were replaced by fresh media free of TGFB1 at the end of day 2, incubated with the cells for an additional day, and then collected as tubular cell-CM for immunoblots of secreted FGF2 (n = 3 experiments). Note that only residual amount of TGFB1 was detected in the CMs. (B-D) Subconfluent NRK-49F fibroblasts were incubated with CM either from control BUMPT cells (control-CM) or TGFB1-treated BUMPT cells (TGFB1-CM) for 2 days in the presence of FGF2 neutralizing antibody at 5, 10, 20 µg/ml or mouse IgG (indicated as FGF2 Ab of 0 µg/ml) as negative control (n = 7 experiments). (B) Cell number counting and cellular protein measurement. (C) Immunoblots of COL1A1, FN1 and ACTA2. (D) Densitometry of COL1A1, FN1 and ACTA2 proteins. (E-G) Subconfluent NRK-49F fibroblasts were incubated with Atg7 WT control-CM, Atg7 WT TGFB1-CM, atg7 KO control-CM, or atg7 KO TGFB1-CM for 2 days. FGF2 neutralizing antibody was added to Atg7 WT TGFB1-CM at the concentrations of 5, 10, 20 µg/ml or mouse IgG (indicated as FGF2 Ab of 0 µg/ml) was used as negative control (n = 5 experiments). (E) Cell number counting and cellular protein measurement. (F) Immunoblots of COL1A1, FN1 and ACTA2. (G) Densitometry of COL1A1, FN and ACTA2 proteins. Data in (B, D, E and G) are presented as mean ± SD. For statistics, one-way ANOVA with multiple comparisons was used for (B and D). Both one-way and two-way ANOVA with multiple comparisons were used for (E and G).
