
Figure 2.
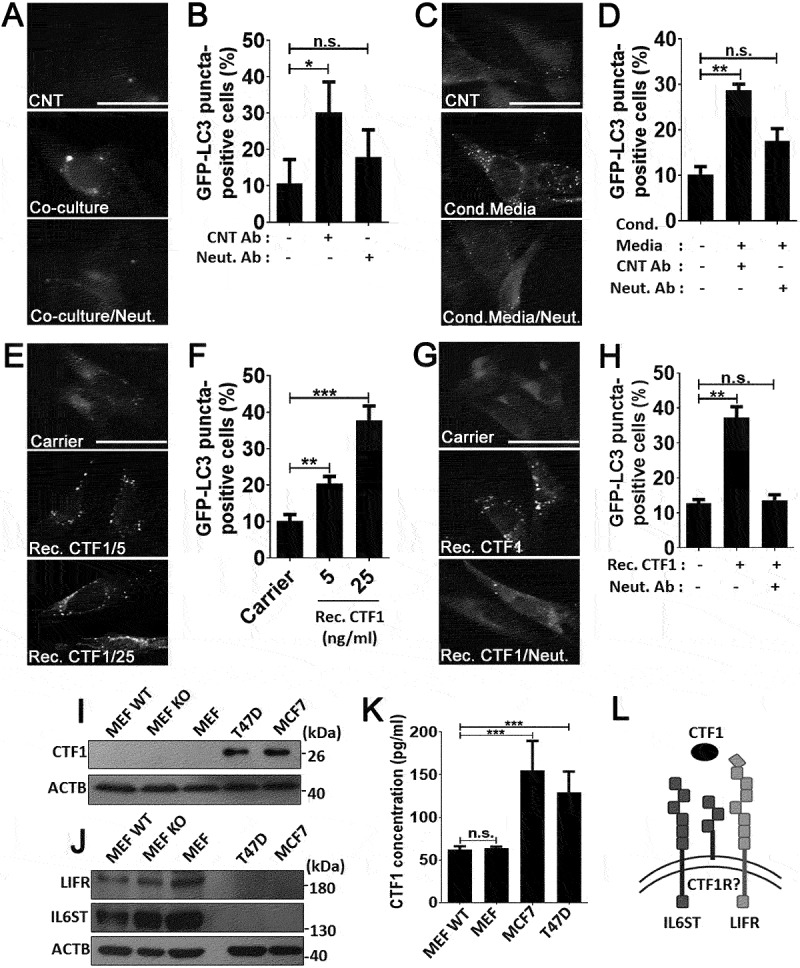
CTF1 was the responsible factor inducing autophagy in fibroblasts. Representative images (a) and quantification of GFP-LC3 positivity (b) in fibroblasts that were co-cultured in transwell plates with MCF7 breast cancer cells or not, in the presence of CTF1 neutralizing antibody (Neut. Ab) or control antibody (CNT Ab) (mean ± SD of independent experiments, n = 3, **: p < 0.01, n.s.: not significant). Representative images (c) and quantification of GFP-LC3 positivity (d) in fibroblasts that were treated with HEK-derived control conditioned media (Cond. Media) or CTF1 plus CTF1 neutralizing antibody (Neut. Ab) or control antibody (CNT Ab) (mean ± SD of independent experiments, n = 3, **: p < 0.01, n.s.: not significant). Representative images (e) and GFP-LC3 positivity quantifications (f) of autophagy in fibroblast treated with increasing doses of bacterial recombinant CTF1 protein (Rec. CTF1). Representative images (g) and quantification (h) of GFP-LC3 positivity in fibroblasts that were treated with bacterial recombinant CTF1 or CTF1 plus neutralizing antibody (Neut. Ab) were shown (mean ± SD of independent experiments, n = 3, **: p < 0.01; n.s.: not significant). (i) Endogenous CTF1 protein expression in wild-type (MEF-WT), atg5 KO (MEF KO) and GFP-LC3 transgenic (MEF) fibroblasts and T47D and MCF7 breast cancer cells. kDa, Molecular Weight in kilodaltons (j) Endogenous protein levels of CTF1 receptor components IL6ST/gp130 and LIFR in MEFs and breast cancer cells. (k) Graph depicting ELISA analysis of CTF1 secretion from MEFs and breast cancer cell lines (mean ± SD of independent experiments, n = 6, ***: p < 0.001). (l) Schematic representation of CTF1 receptors IL6ST/gp130, LIFR and CTF1 specific receptor (CTF1R?) and CTF1 (depicted as an oval). Scale bar: 20 µm.