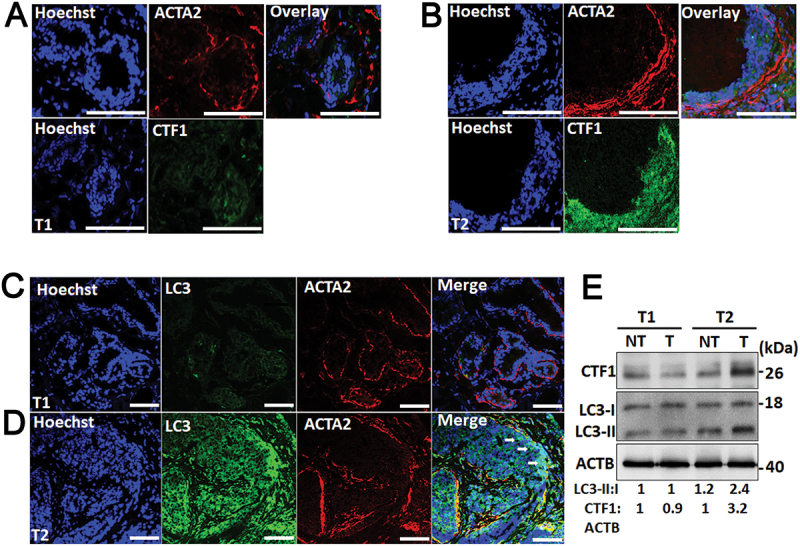
Figure 8.

ACTA2/α-SMA and LC3 immunostaining in CTF1 high and low breast cancer specimen. (a) Representative images of nuclei (Hoechst 33,342, Blue), anti-ACTA2/α-SMA (red) and anti-CTF1 (green) immunostaining of a T1 breast cancer tissue. (b) Similar immunostaining analysis of a T2 breast cancer tissue. (c) Representative images of nuclei (Hoechst 33,342, Blue), anti- ACTA2/α-SMA (red) and anti-LC3 (green) immunostaining of a T1 breast cancer tissue. (d) Similar immunostaining analysis of a T2 breast cancer tissue. Arrows, LC3 and ACTA2/α-SMA signal overlap areas. (e) Immunoblot analysis of CTF1 and LC3 proteins in non-tumor and tumor samples of T1 and T2 breast cancer tissue. LC3-II:I and CTF1:ACTB band ratios were quantified by ImageJ analysis. Scale bar: 100 µm.
