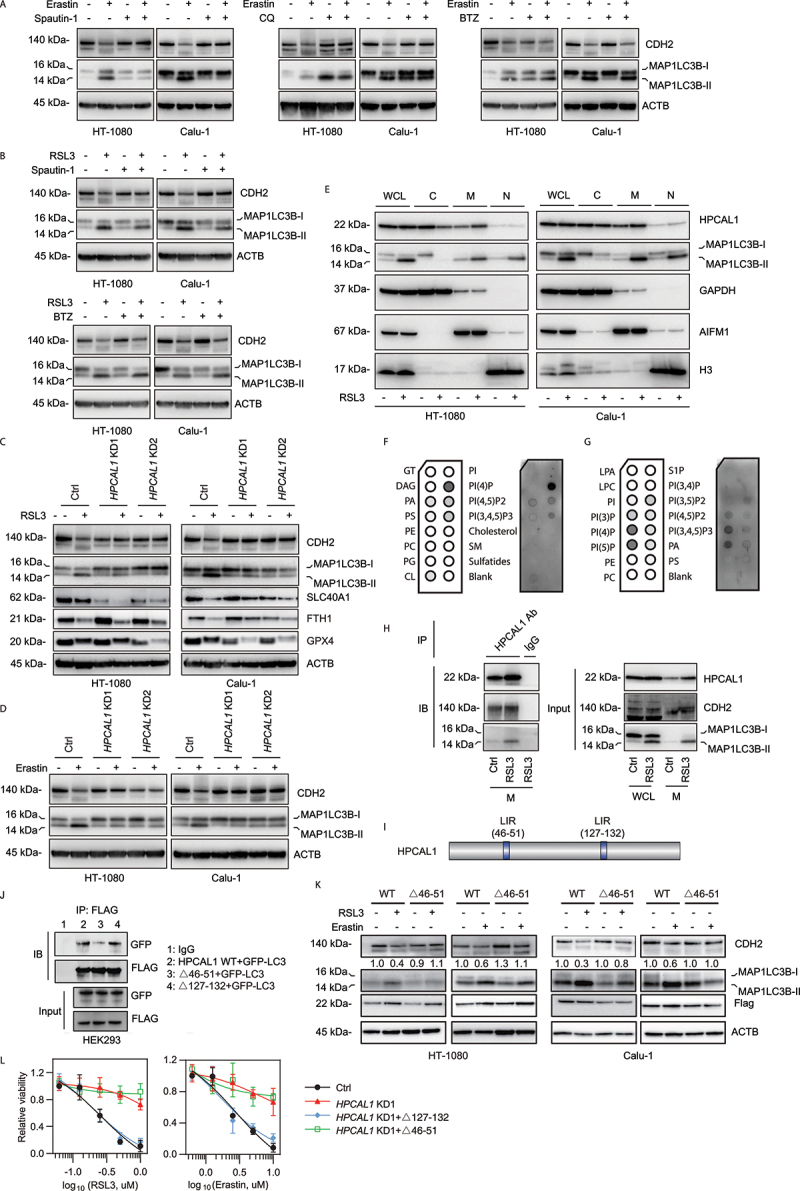
Figure 3.

HPCAL1 promotes CDH degradation during ferroptosis. (a, b) Western blot analysis of the indicated protein expression in HT-1080 cells following treatment with erastin (5 μM, 12 h) or RSL3 (0.5 μM, 6 h) in the absence or presence of spautin-1 (5 μM), chloroquine (CQ; 20 μM) or bortezomib (BTZ; 0.1 μM). (c, d) Western blot analysis of the indicated protein expression in control and HPCAL1-knockdown (HPCAL1 KD) HT-1080 and Calu-1 cells following treatment with (c) 0.5 μM RSL3 (6 h) or (d) 5 μM erastin (12 h). (e) Western blot analysis of whole cell lysates (WCL) or cell fractionation (C: cytoplasmic; M: membrane; N: nuclear/cytoskeletal) of HT-1080 and Calu-1 cells following treatment with RSL3 (0.5 μM) for 4 h. (f, g) The protein-lipid overlay assay of the interaction between HPCAL1 protein and lipid. Recombinant HPCAL1 was incubated with a membrane spotted with the indicated lipids and analyzed by chemiluminescent detection. PI: phosphatidylinositol. (h) Immunoprecipitation (IP) analysis of HPCAL1-binding proteins in membrane fractionation of Calu-1 cells following treatment with RSL3 (0.5 μM) for 4 h. IB, immunoblot. WCL: whole cell lysate. M: membrane fractionation. (i) Predicted LC3-interacting region (LIR) domain in human HPCAL1 protein. (j) HEK293 cells were co-transfected with indicated FLAG-tagged HPCAL1and GFP-LC3 plasmid. Cell lysates were subjected to immunoprecipitation with anti-FLAG antibodies. Western blots of the immunoprecipitates and of the cell extracts were revealed using anti-GFP polyclonal antibodies to detect GFP-LC3 or anti-FLAG monoclonal antibodies to detect FLAG-tagged HPCAL1. (k) Effects of LIR deletion (Δ46-51) in HPCAL1 on CDH2 degradation in HT-1080 or Calu-1 cells following treatment with RSL3 (0.5 μM, 6 h) or erastin (5 μM, 12 h). (l) Analysis of cell viability in control, HPCAL1-knockdown (HPCAL1 KD1), or indicated HPCAL1 rescue HT-1080 cells following treatment with RSL3 or erastin for 24 h (n = 3 biologically independent samples; data are presented as means ± SD).
