
Figure 4.
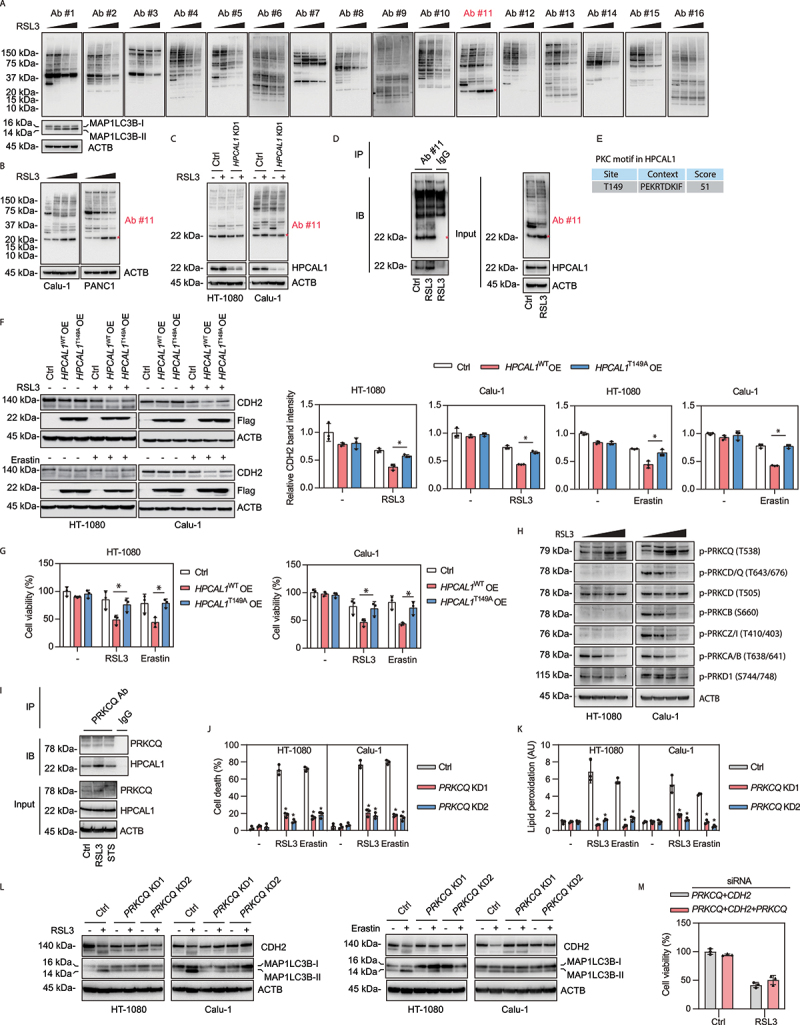
Phosphorylation of HPCAL1 is required for ferroptosis. (a) Western blot analysis of protein expression using a commercial KinomeView Profiling Kit in HT-1080 cells following treatment with RSL3 (0.5 μM) for increasing time periods (3, 6, and 9 h). Ab#1: phospho-AKT substrate (110B7E); Ab#2: phospho-AKT substrate (23C8D2); Ab#3: phospho-(Ser/Thr) AMPK substrate (P-S/T2-102); Ab#4: phospho-(Ser) ATM/ATR substrate (D23 H2/D69H5); Ab#5: phospho-(Ser/Thr) ATM/ATR substrate (S*/T*QG) (P-S/T2-100); Ab#6: phospho-(Ser) CDK substrate (P-S2-100); Ab#7: phospho-(Ser/Thr) CSNK2/CK2 substrate (P-S/T3-100); Ab#8: phospho-MAPK/CDK substrate (34B2); Ab#9: phospho-(Ser/Thr) PDK1 docking motif (18A2); Ab#10: phospho-PRKA/PKA substrate (100G7E); Ab#11: phospho-(Ser) PRKC/PKC substrate (P-S3-101); Ab#12: phospho-(Thr) PLK binding motif (D73 F6); Ab#13: phospho-Thr-Pro motif; Ab#14: phospho-Thr-Pro-Glu (C32 G12); Ab#15: phospho-Thr-X-Arg motif; Ab#16: phospho-tyrosine (P-Tyr-1000). (b) Western blot analysis of protein expression using Ab#11 antibodies in Calu-1 and PANC1 cells following treatment with RSL3 (0.5 μM) for increasing time periods (3, 6, and 9 h). (c) Western blot analysis of protein expression using Ab#11 antibodies in control and HPCAL1-knockdown (HPCAL1 KD1) HT-1080 and Calu-1 cells following treatment with 0.5 μM RSL3 for 6 h. (d) Immunoprecipitation (IP) analysis of PRKC/PKC motif-containing proteins in HT-1080 cells following treatment with RSL3 (0.5 μM) for 4 h. IB, immunoblot. (e) Prediction of PRKC/PKC motif in human HPCAL1 protein. (f) Western blot analysis of the indicated protein expression in control or wild-type HPCAL1 (HPCAL1 OE)- or T149A mutated (HPCAL1T149A OE)-overexpressing HT-1080 and Calu-1 cells following treatment with RSL3 (0.5 μM, 6 h) or erastin (5 μM, 12 h). (g) Cell viability of the indicated HT-1080 or Calu-1 cells following treatment with RSL3 (0.1 μM) or erastin (1 μM) for 24 h (n = 3 biologically independent samples; two-way ANOVA with Tukey’s multiple comparisons test; data are presented as mean ± SD). (h) Western blot analysis of the indicated protein expression in HT-1080 or Calu-1 cells following treatment with RSL3 (0.5 μM) for increasing time periods (2, 4, and 6 h). (i) Immunoprecipitation (IP) analysis of PRKCQ-binding proteins in HT-1080 and Calu-1 cells following treatment with RSL3 (0.5 μM) or staurosporine (0.5 μM) for 4 h. IB, immunoblot. (j) Analysis of cell death in control and PRKCQ-knockdown (PRKCQ KD) HT-1080 and Calu-1 cells following treatment with RSL3 (0.5 μM) or erastin (5 μM) for 24 h (n = 3 biologically independent samples; *P < 0.05 versus control shRNA group; two-way ANOVA with Tukey’s multiple comparisons test; data are presented as mean ± SD). (k) Control and PRKCQ-knockdown (PRKCQ KD) HT-1080 and Calu-1 cells were treated with RSL3 (0.5 μM, 4 h) or erastin (5 μM, 6 h). The level of lipid peroxidation in cells was assessed with C11-BODIPY 581/591 (n = 3 biologically independent samples; *P < 0.05 versus control shRNA group; two-way ANOVA with Tukey’s multiple comparisons test; data are presented as mean ± SD). (l) Western blot analysis of the indicated protein expression in control and PRKCQ-knockdown (PRKCQ KD) HT-1080 and Calu-1 cells following treatment with RSL3 (0.5 μM, 6 h) or erastin (5 μM, 12 h). (m) Cell viability of indicated Calu-1 cells following treatment with RSL3 (0.5 μM) for 24 h (n = 3 biologically independent samples; data are presented as mean ± SD).