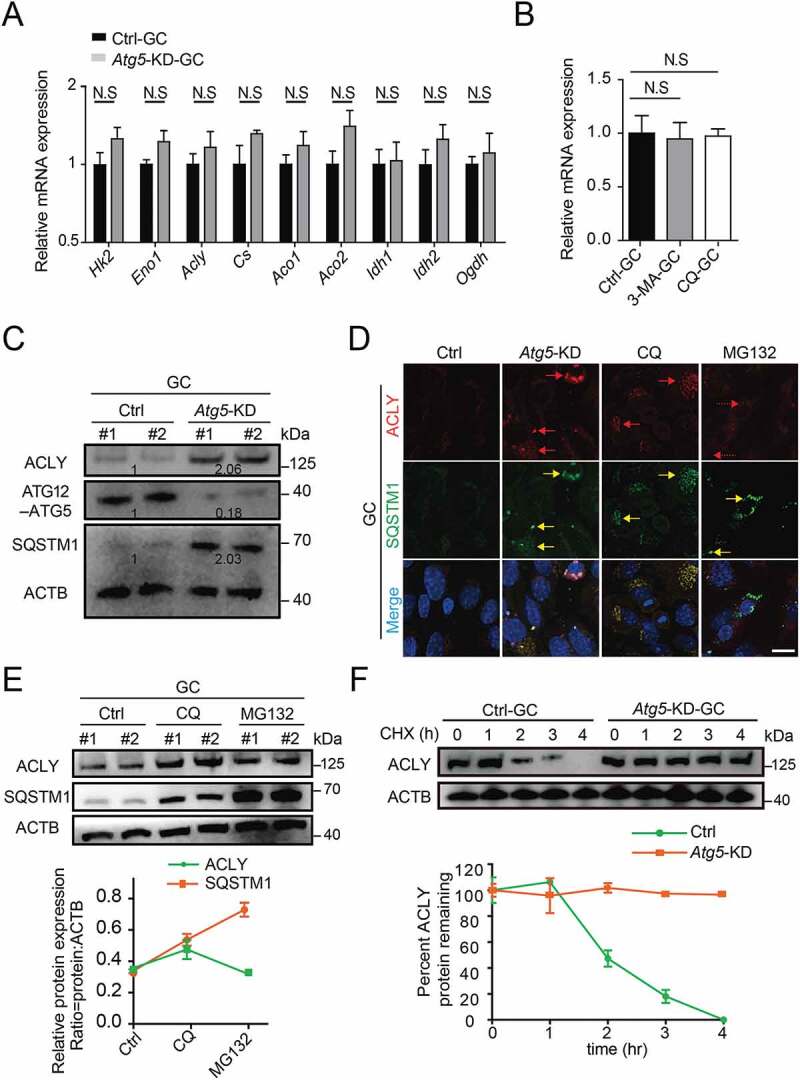
Figure 5.

Atg5-mediated autophagy targets ACLY for lysosomal degradation. (A) The mRNA levels of TCA cycle-related genes in the control and Atg5 knockdown cumulus granulosa cells. The values are presented as the means ± SEM, n = 3. N.S represents not significant. (B) The levels of Acly mRNA in the granulosa cells subjected to 3-MA and CQ treatment. The values are presented as the means ± SEM, n = 3. N.S represents not significant. (C) Depletion of the autophagy essential gene Atg5 affects the expression levels of ACLY- SQSTM1 complex. Each lane corresponds to an independent biological sample. Normalized quantification of mean gray intensity was determined from 3 separate experiments. (D) The expression and subcellular location of ACLY and SQSTM1. Granulosa cells co-transfected with or without Atg5 shRNA were treated as indicated inhibitors for 6 h. Confocal images of transfected cells representing the colocalization of ACLY with SQSTM1. ACLY are marked in red, and SQSTM1 are marked in yellow. The merged images and relative arrows reveal the colocalization. Scale bar: 10 μm. (E) Autophagy promotes the degradation of ACLY. Immunoblot analysis of ACLY in granulosa cells with CQ (50 μM) or MG132 (10 μM) treatment for 6 h. Quantification of protein by calculating the ratio of ACLY:SQSTM1 with ACTB. Error bars indicate the SD (n = 3). Each lane corresponds to an independent biological sample. (F) ACLY is stabilized in Atg5 knockdown cells. Granulosa cells silenced with control, Atg5 shRNA were then treated with CHX for the indicated time. The percentage of remaining ACLY protein was calculated from the intensity of CHX treatment immunoblots, measured in three biological replicates.
