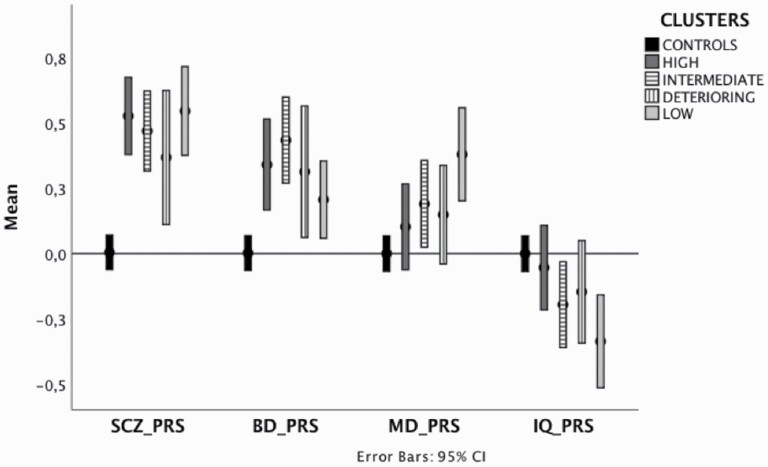
Fig. 2.
Polygenic risk scores across different clusters of FEP and controls. Legend: The Y-axis indicates z-scores for PRSs. Higher standardized scores indicate higher genetic risk for the SCZ_PRS, BD_PRS, and MD_PRS. For IQ_PRS, lower standardized scores indicate a predisposition to worse IQ. All the PRSs were adjusted to account for age, sex, country, and ten PCs and standardized around controls’ means and standard deviations. Each controls’ PRS represents a mean of 0 and a standard deviation of 1. Error bars represent 95% CIs. HIGH = high-cognitive-functioning; LOW = low-cognitive-functioning.

