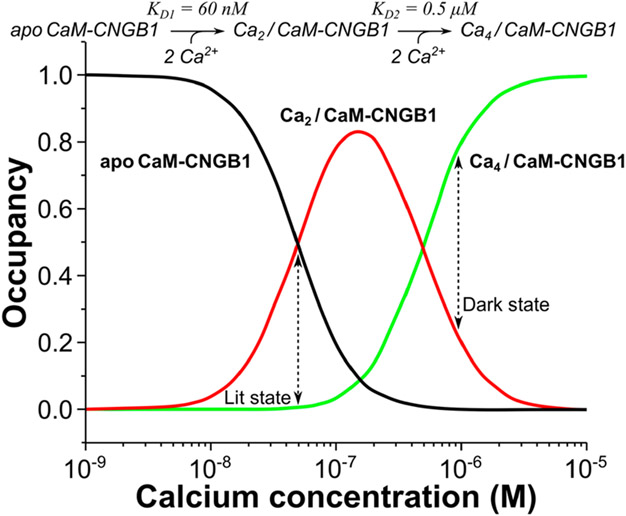
Figure 8.
Occupancy of CNGB1-bound CaM species vs [Ca2+]. Concentration profiles of apoCaM bound to CNGB1 (apoCaM-CNGB1, black), half-calcified CaM bound to CNGB1 (Ca2/CaM-CNGB1, red line), and Ca2+-saturated CaM bound to CNGB1 (Ca4/CaM-CNGB1, green line). The concentration profiles were calculated according to the kinetic model shown at the top of the plot as described in the Materials and Methods section.

