
Fig. 8.
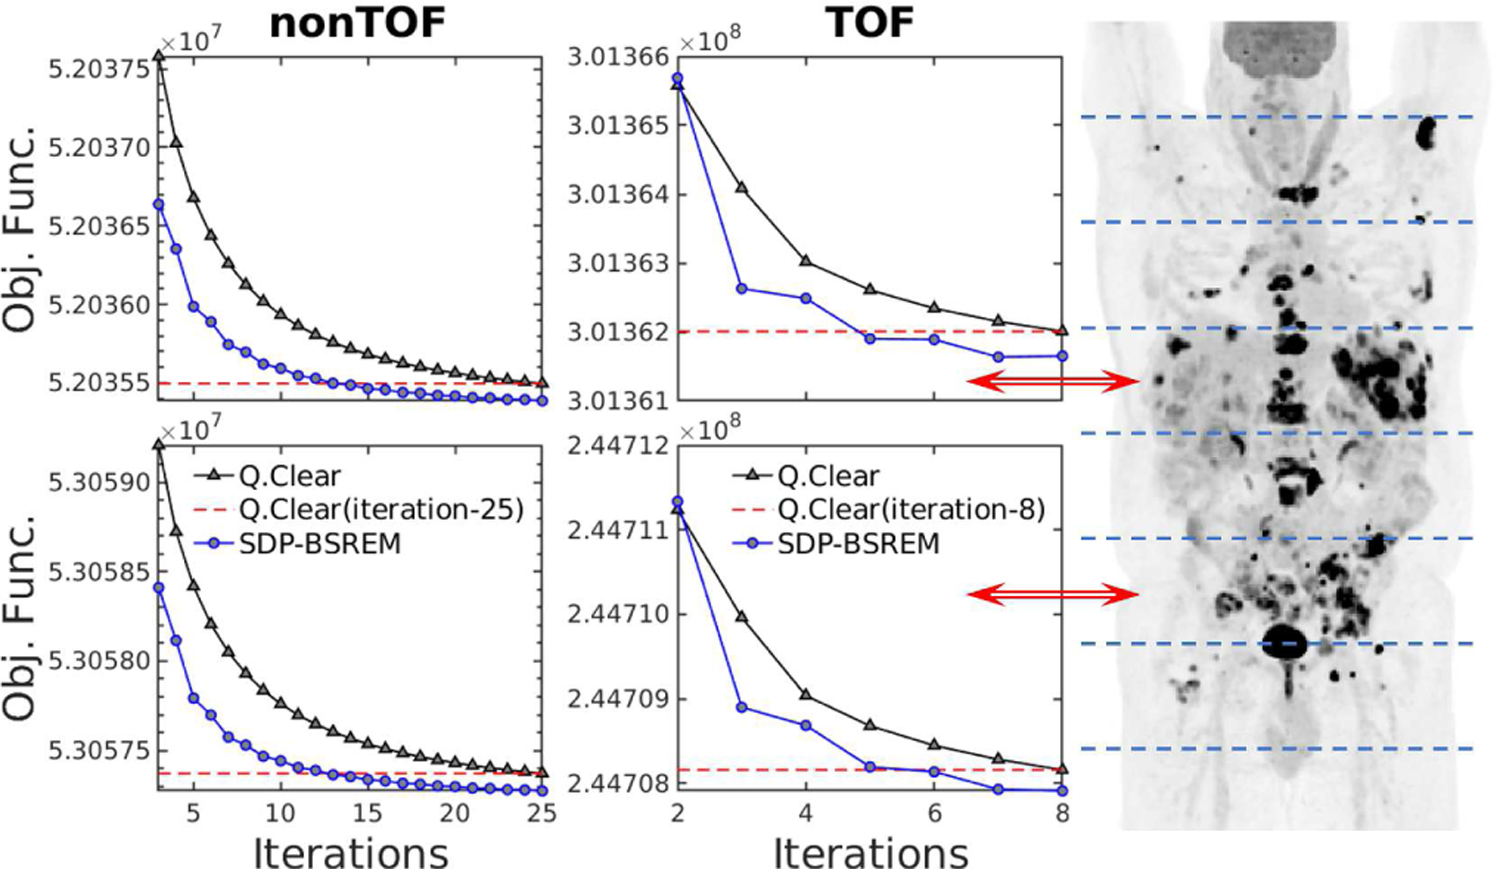
Comparison of performance of SDP-BSREM vs. Q.Clear (β = 350) algorithms. A whole-body 18F-FDG clinical PET patient scan was used. Eight patient bed positions separated by dashed lines are shown in the coronal maximum intensity projection (MIP) image. The objective function vs. iterations is shown for PET scanner patient bed positions 4 and 6 (red arrows) for nonTOF (left) and TOF data (right). The dashed lines represent the objective function values at the final Q.Clear iterations.