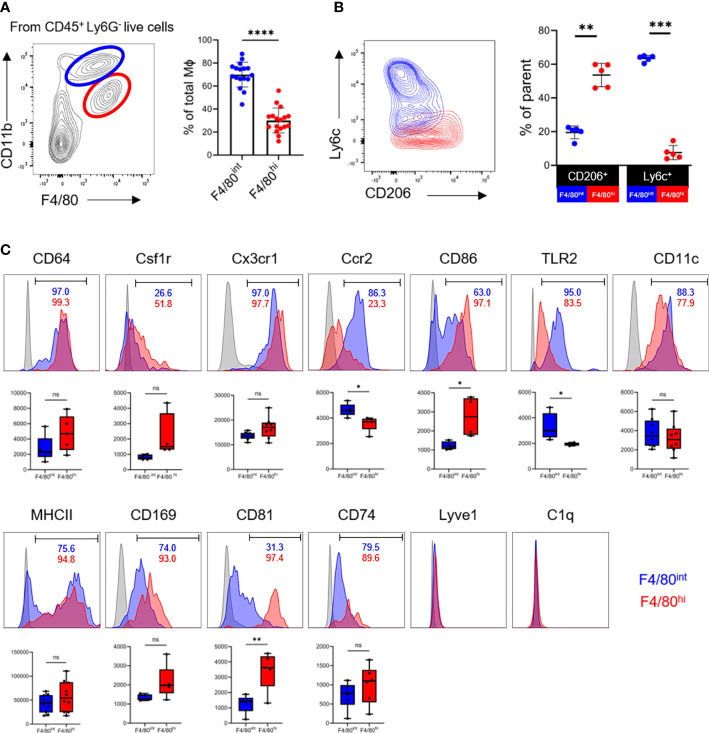
Figure 2.
Two phenotypically distinct macrophage populations reside in the ovary. (A) The contour plot depicts the gating strategy for macrophages subsets and graphs show the proportion of F4/80intCD11bhi (blue) and F4/80hiCD11bint (red) macrophage populations in the ovaries (n=17. Mean ± SEM). (B) Expression of Ly6c and CD206 in two subpopulations of macrophages (n=5. Mean ± SEM). (C) Representative histogram, positivity ratios and mean fluorescence intensity (MFI) of macrophage surface markers expression. ns, no significance, *P < 0.05, **P < 0.01, ***P < 0.001, ****P < 0.0001.

