Fig. 2.
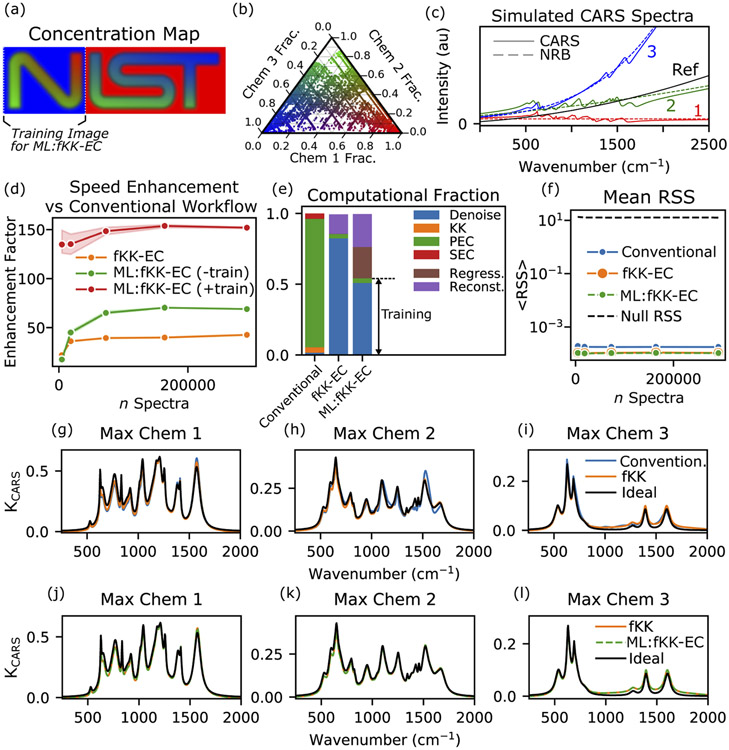
(a) Concentration map of simulated dataset composed of three chemical constituents, colored as red (Chem 1), green (Chem 2), and blue (Chem 3). (b) Ternary plot showing the concentration of the simulation. (c) CARS (solid lines) and NRB (dashed) spectra of the three pure constituents. The spectra of a reference surrogate is shown in black. (d) Processing speed enhancement of fKK-EC and ML:fKK-EC with respect to conventional processing. Each trace shows the mean enhancement over three runs with the shading showing ±1 standard deviation. (e) Fraction of computing time of each step. Note: only fKK-EC and ML:fKK-EC have a reconstruction (Reconst.) step. Also, only the ML:fKK-EC has a regression (Regress.) step. (f) Mean RSS showing the factorized methods show relatively similar, if not improved, RSS values from the conventional workflow. (g)–(i) Comparison of single-pixel spectra processed using the conventional methods and the fKK-EC. (j)–(l) Comparison of single-pixel spectra processed using the fKK-EC and the ML:fKK-EC.

