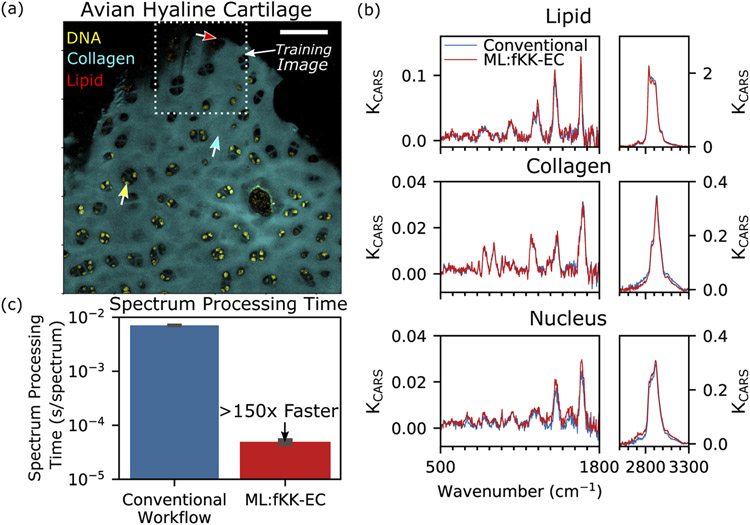
Fig. 4.
Pseudocolor image derived from ML:fKK-EC processed CARS image, highlighting DNA (yellow), collagen (cyan), and lipids (red). The dashed-white box indicates the sub-image used for training. Scale bar is 100 μm. Arrows identify single-pixels used for spectral comparison in (b) between conventional and ML:fKK-EC workflow, which shows close agreement. (b) Single pixel spectra for locations identified by arrows in (a). (c) Comparison of spectrum processing time between conventional and ML:fKK-EC workflow.

