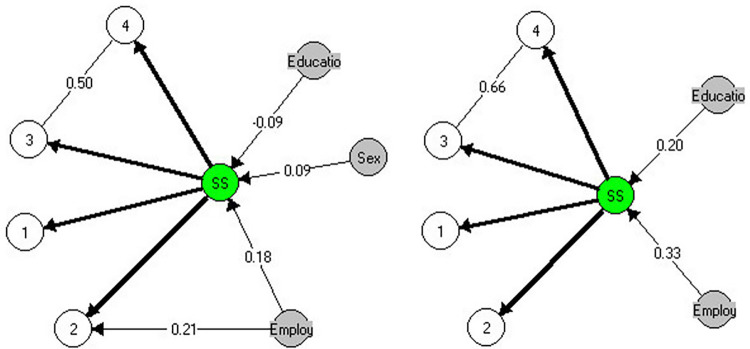
Fig 1.
GLLRMs of the SSS for sample 1 (left) and sample 2 (right). Note. The Markov graph nodes represent the item numbers, the exogenous variables, and the latent trait. Disconnected nodes indicate that variables are conditionally independent and partial γ inform the magnitude of the LD and DIF. When LD/DIF was unsubstantial (γ<0.1), the edges were omitted (see S1 Fig).

