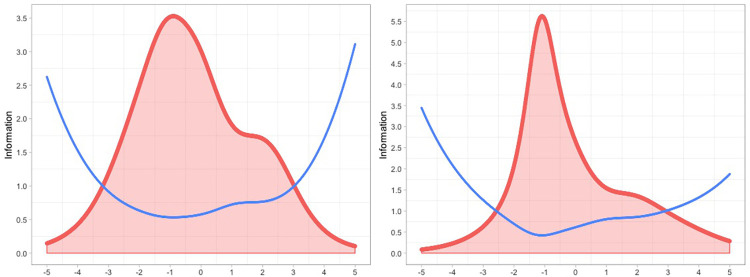
Fig 3.
Test Information function for sample 1 (left) and sample 2 (right). Note. The x-axis indicates the latent trait (“Social support”) and the y-axis indicates the information. The red line with shaded area represents the Test Information Function and the blue line represents the Standard Error of Measurement (SEM).

