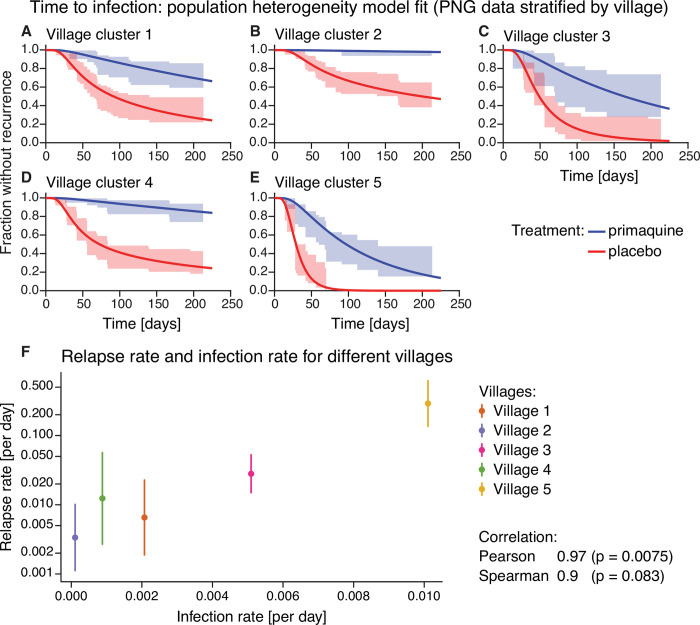
Fig 5. Time to infection population heterogeneity model fit and relapse rate vs infection rate for different villages in the Papua New Guinea data.
(A-E) Model fit of the population heterogeneity model to the time to infection data from Papua New Guinea stratified by village. All villages were fit simultaneously with the same drug washout time distribution, the rate of new infections and relapses was allowed to vary between villages. The lines indicate the model fit and the shaded area the 95% confidence region from the data. (F) Relapse rate and infection rate for different villages. For each village, the median relapse rate (dot) and interquartile range (vertical line) of the relapse rate distribution from the population heterogeneity model fit is plotted against the infection rate. The Pearson and Spearman correlation between the log-transformed median relapse rate and the infection rate are 0.97 and 0.9, respectively, with p-values of 0.0075 and 0.083, respectively. For model fits to the Papua New Guinea data by village using the other models see Figs C and D in S1 Figs.

