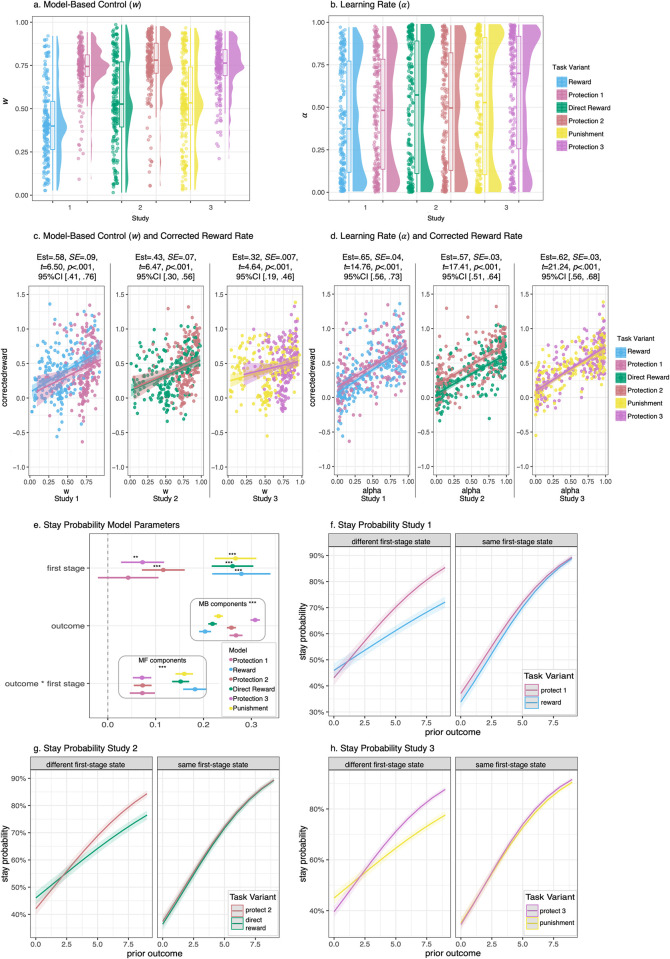
Fig 2. Model-Based Control and Learning Rate Results.
a-b. Raincloud plots depicting model-based control weighting (ω) and learning rate (α) by study and task variant. ω was significantly higher for the protection variants compared to all other task variants. α did not significantly differ across task variants. Far right legend indicates task variants across all studies: Study 1 = Reward and Protection 1, Study 2 = Direct Reward and Protection 2, Study 3 = Punishment and Protection 3. c-d. Scatterplots and linear regression lines depicting positive associations between both ω and α with corrected reward rate by study and task variant. Higher ω and α were significantly associated with higher corrected reward rate for all task variants. e. Mixed-effects model parameters testing contributions of the first-stage state, prior trial outcome, and interaction between first-stage state and prior trial outcome on stay probabilities. Effects from both model-free and model-based contributions were observed. MF = model-free control; MB = model-based control. f-h. Mixed-effects models testing model-based (different first-stage state) and model-free (same first-stage state) contributions to stay probabilities (likelihood of repeating the same second-stage state). Increased model-based contributions were revealed on the protection task variants compared with all other task variants.

