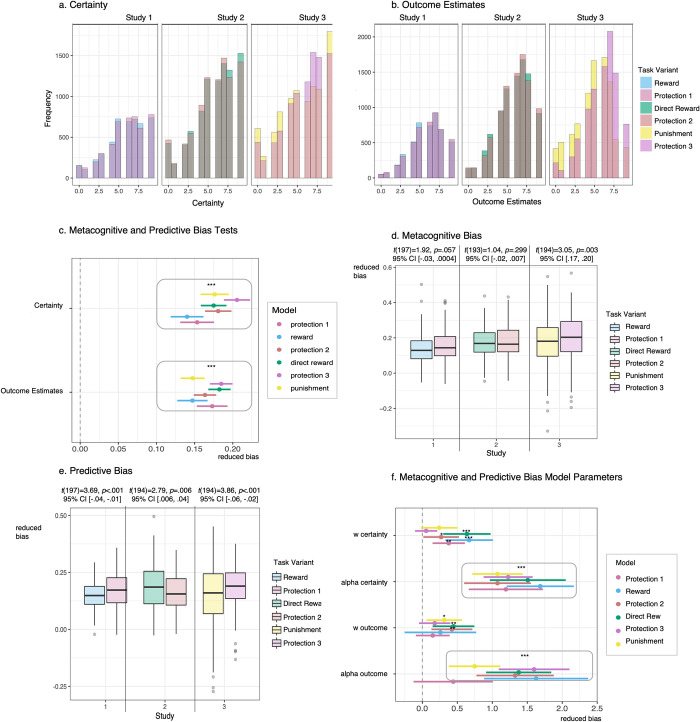
Fig 3. Metacognitive and predictive bias results.
a. Histograms depicting Certainty ratings by study and task variant. Certainty was rated with respect to how sure subjects felt they were that they selected the first-stage state that would lead to the most optimal outcomes. Certainty ratings were made on a scale of 0–9 from not at all certain to very certain. b. Histograms depicting Outcome Estimates by study and task variant. Outcome Estimates were provided with respect to how many outcome units subjects thought they would receive at the second-stage. Outcome Estimates were made on a scale of 0–9 outcome units (i.e., subjects who rated a 2 thought they would receive 2 shields/sacks/coins/flames, respectively). c. Mixed-effects model parameters testing metacognitive and predictive bias by modeling actual outcome received as a function of Certainty and Outcome Estimates, respectively. d. Metacognitive bias boxplots by study and task variant. Metacognitive bias was calculated by extracting random slope coefficients from the model of outcome predicting Certainty. Significant differences were only identified in Study 3 with reduced bias for the protection acquisition variant compared to the punishment avoidance variant. e. Predictive bias boxplots by study and task variant. Predictive bias was calculated by extracting random slope coefficients from the model of outcome predicting Outcome Estimates. Significantly reduced bias was revealed for the protection acquisition variants compared to the reward acquisition and punishment avoidance variants, but not compared to the direct reward variant. f. Model parameters for metacognitive and predictive bias coefficients regressed against model-based control weighting (ω) and learning rate (α) parameters for each task variant. Far right legends indicate task variants across all studies: Study 1 = Reward and Protection 1, Study 2 = Direct Reward and Protection 2, Study 3 = Punishment and Protection 3.

