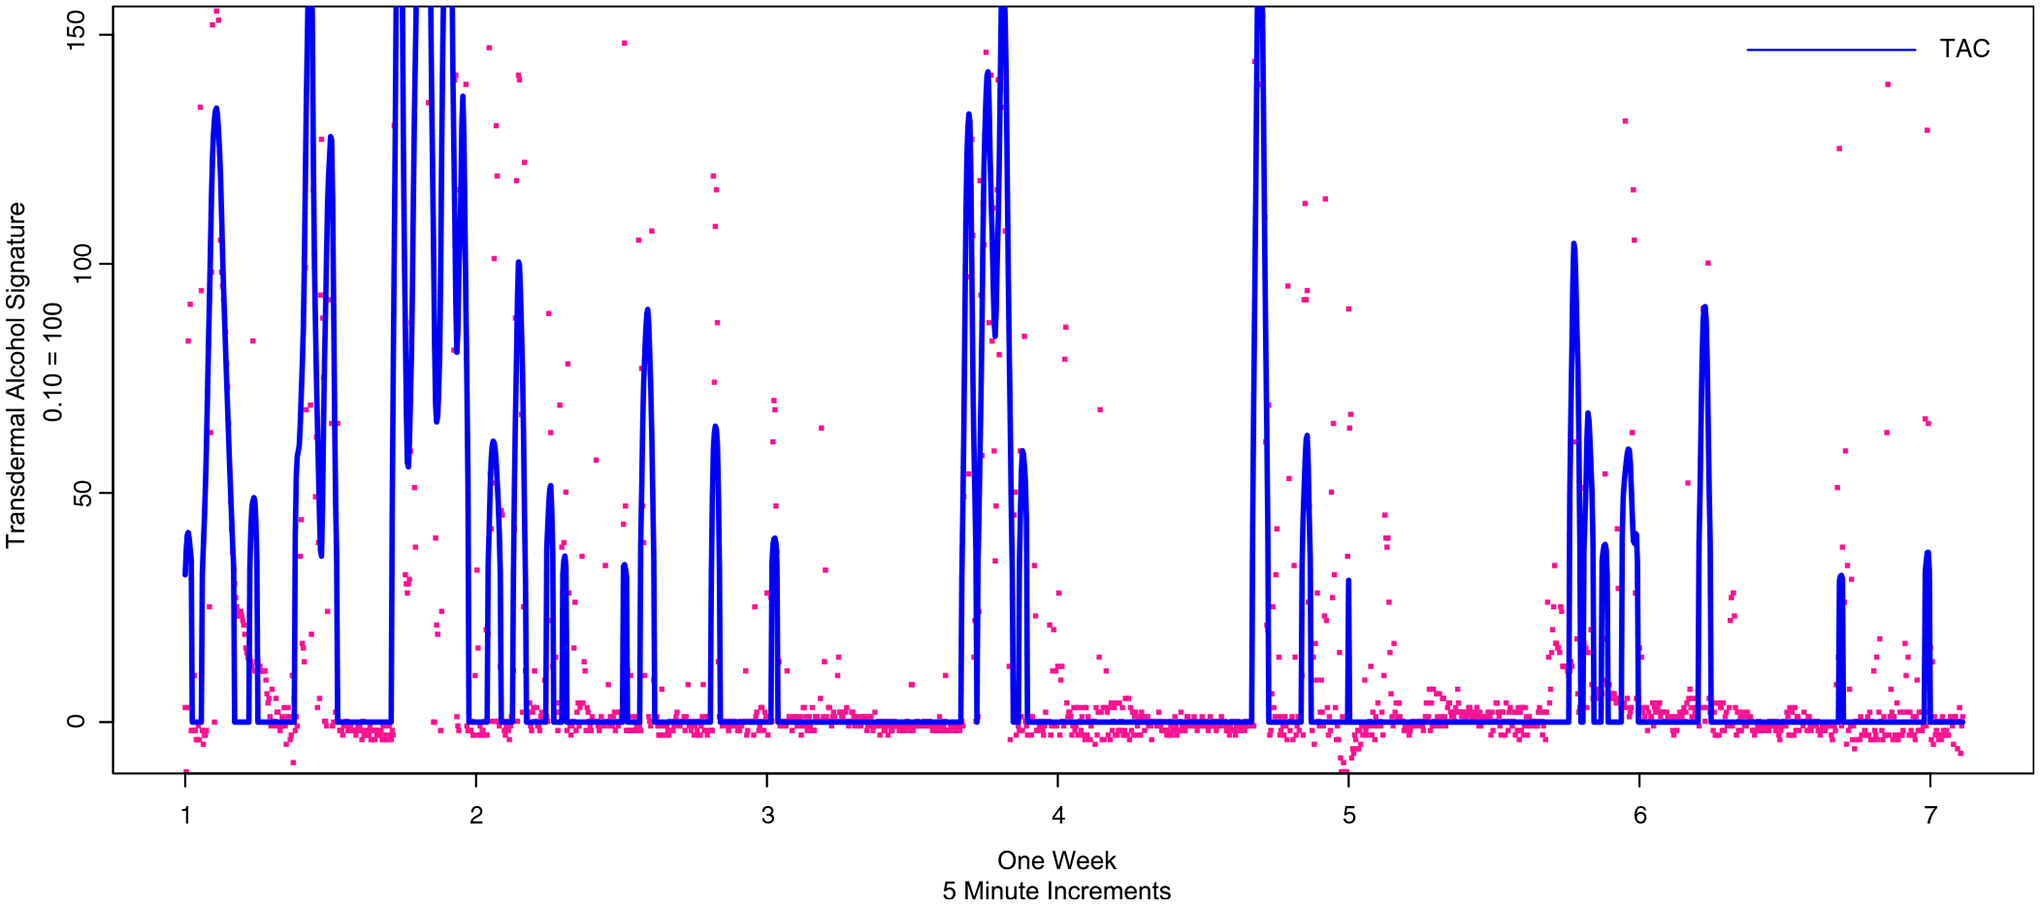
Figure 2.

One week of transdermal alcohol data, assessed by coders as noisy sensor data, therefore, coded as missing data. As with Figure 1, adjustment for baseline and locally estimated scatterplot smoothing and prediction in blue and raw data points in red.
