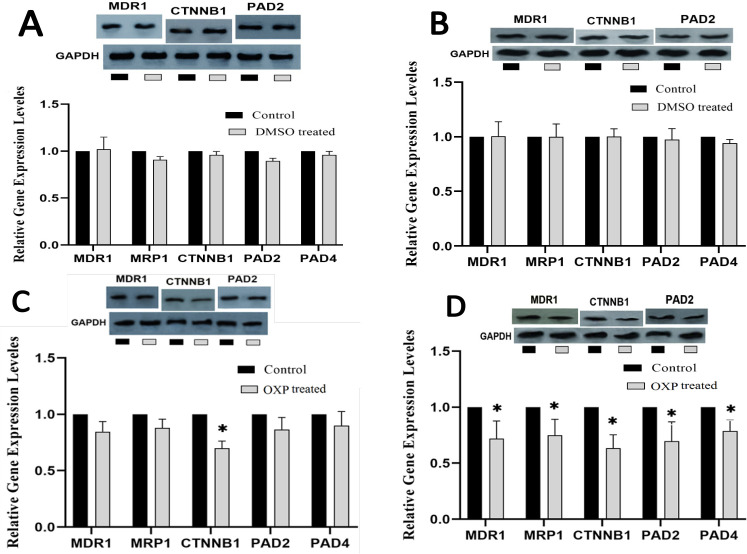
Figure 2.
Comparative Gene and Protein Expressions Profiling of MDR, MRP1 (210 kDa), CTNNB1, PAD2, and PAD4 in LS174T/OXP treated with DMSO 24 h (A), DMSO 48 h (B), OXP 24 h (C), and OXP 48 h (D) incubated. Concentration of NTZ, 40 µM; and OXP, 5 µM. MDR1(150 kDa), MRP1(210 kDa), PAD2 (101 kDa). Each point represents the mean ± S.D. * p < 0.05, ** p < 0.001 vs control

