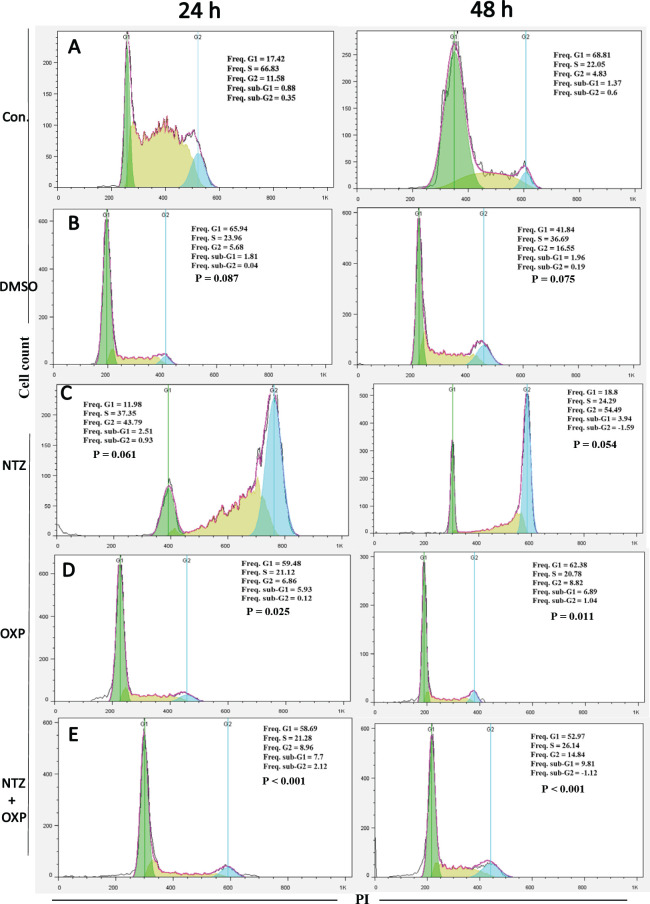
Figure 4.
Cell Cycle Distribution after Treated LS174T/OXP Cells by DMSO, NTZ, OXP, and Combination of NTZ Plus OXP for 24 and 48 h. Flow cytometry histograms indicating cell cycle distribution and apoptosis (sub-G1) after treated the resistant cells with NTZ (40 µM) and OXP (5 µM) or combination them. Data are reported as means ± SD of three independent assays

