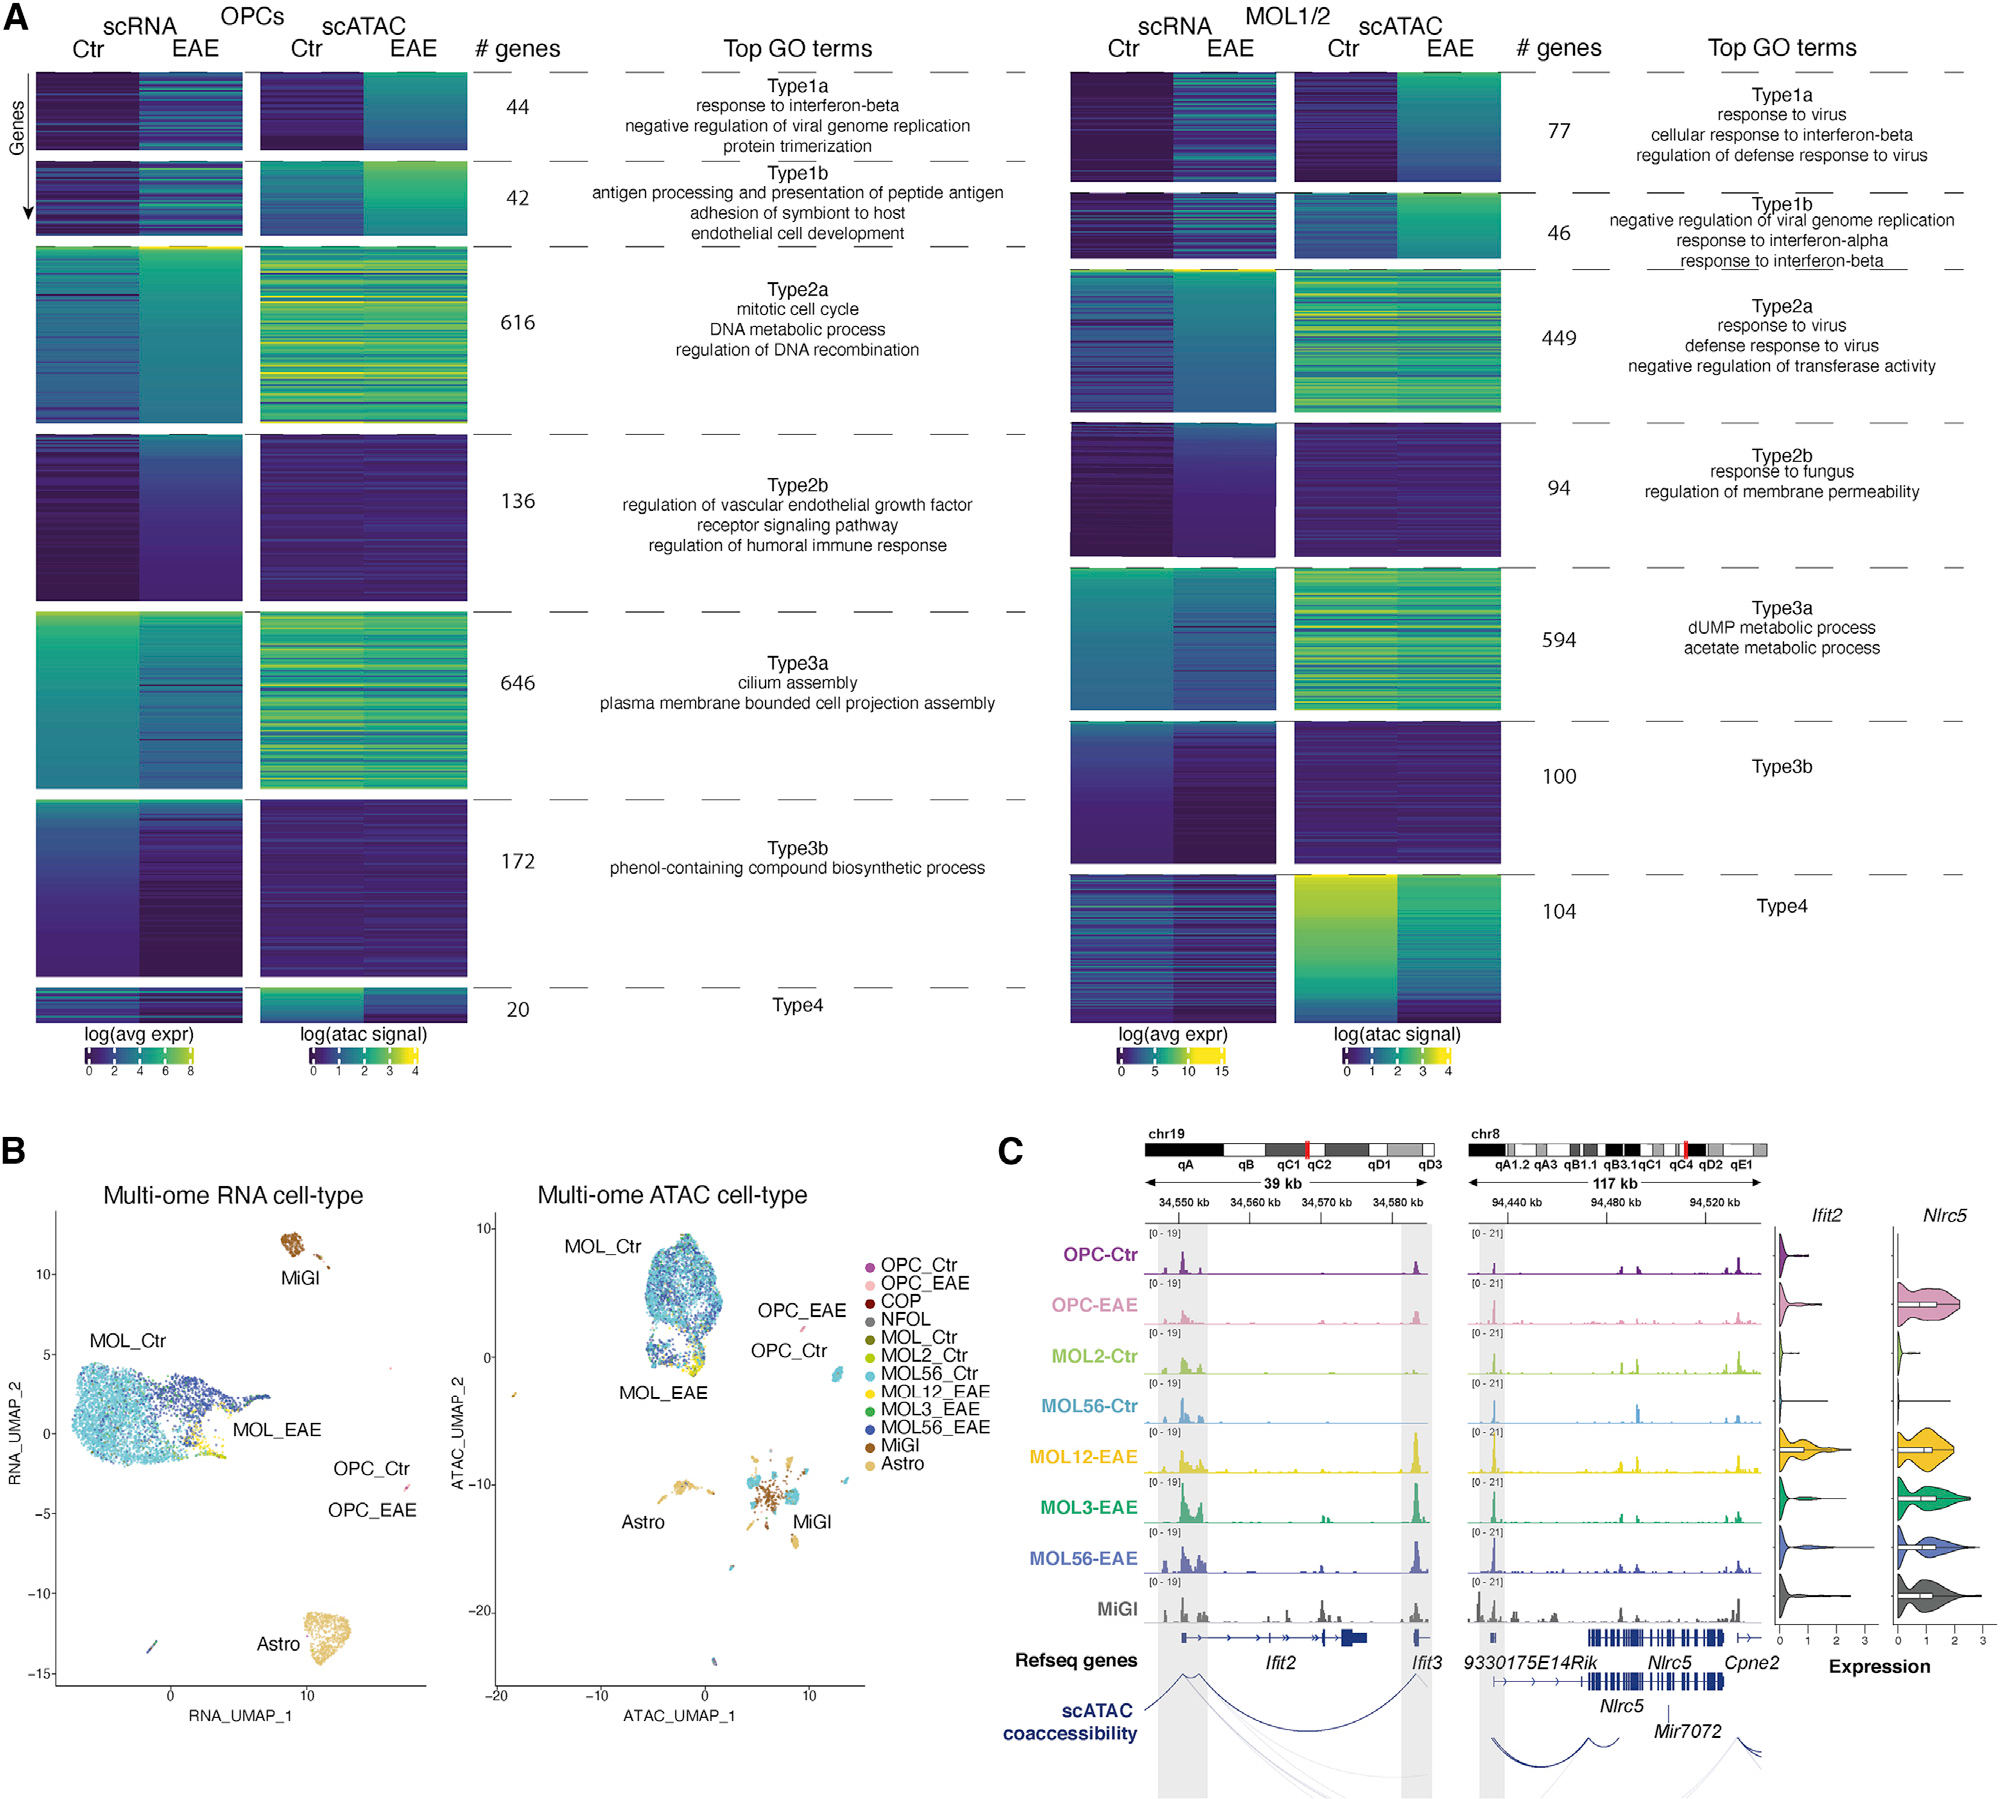
Figure 2. Primed CA of immune genes in single OPCs and MOLs.

(A) Genes in OPCs (left) or MOL1/2 (right) are clustered based on gene expression differences between EAE versus Ctr and correlation with CA activity score (CA over 500-bp promoter region). Top GO terms for Type1 genes (with increased expression and CA in EAE; [Type1a] low and [Type1b] high CA in Ctr-OPCs), Type2 (with increased expression in EAE, but no change in CA, [Type2a] high and [Type2b] low CA in Ctr-OPCs), and Type3 (with reduced expression in EAE, but no change in CA). Type4 (with reduced expression and CA in EAE) had no GO terms.
(B) UMAP based on CA (right) and RNA-seq (left) of 10x Genomics multi-ome (simultaneous scATAC and RNA-seq) of Sox10-GFP cells sorted from the spinal cord of Ctr (2) and EAE mice (2, at disease peak). Label transfer from matched scRNA-seq data (Falcão et al., 2019).
(C) (Left) IGV tracks of CA for each selected cluster, with MiGl clusters grouped together. scATAC co-accessibility connections are shown. Highlighted with gray boxes are regions with differential CA in specific clusters or promoter priming and connections between regulatory regions. Genomic coordinates are shown. (right) Violin plots depicting the expression of Ifit2 and Nlrc5 in each cluster. Cell acronyms as in Figure 1.
