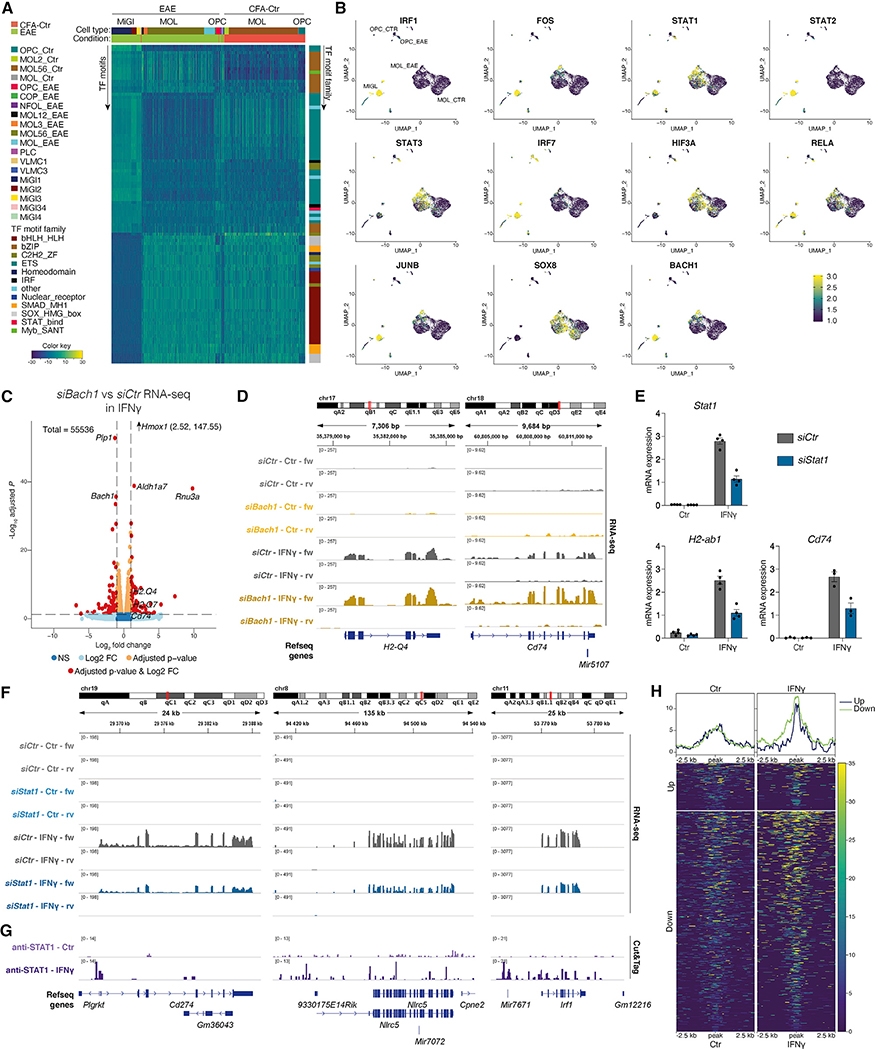
Figure 4. STAT1 and BACH1 have increased motif accessibility (MA) in OLG from EAE and are involved in IFN-γ-mediated regulation of immune genes in OPCs.
(A) ChromVAR clustering of TF motif variability from scATAC-seq. Each row presents a TF motif, whereas each column represents a single cell. Scale, blue (low TF MA) to yellow (high).
(B) TF motif variability projected on top of UMAP of scATAC-seq.
(C) Volcano plots showing differential expressed genes in RNA-seq upon transfection of primary OPCs with siRNAs targeting Bach1 before treating with IFN-γ for 6 h. 4 biological replicates. Genes with adj. p value < 0.05 and log2 fold change >1.5 are shown in red. Hmox1 coordinate values are shown (since beyond y-axis range).
(D) IGV tracks for RNA-seq in IFN-γ-treated OPCs and Ctr-OPCs after transfection with siRNAs targeting Bach1 for selected genes.
(E) qRT-PCR targeting selected genes upon transfection of primary OPCs with siRNAs targeting Stat1 before treating with IFN-γ for 6 h. 3–4 biological replicates. Error bars, mean ± SEM.
(F) IGV tracks for RNA-seq in IFN-γ-treated OPCs and Ctr-OPCs after transfection with siRNAs targeting Stat1 for selected genes.
(G) IGV tracks showing STAT1 binding in OPCs upon IFN-γ treatment and in Ctr-OPCs, assessed with CUT&Tag.3 biological replicates.
(H) Heatmaps depicting STAT1 binding in OPCs treated with IFN-γ at genes that were up- or downregulated by STAT1 knockdown (as assessed by adjusted p value from bulk RNA-seq), centered at peaks.

