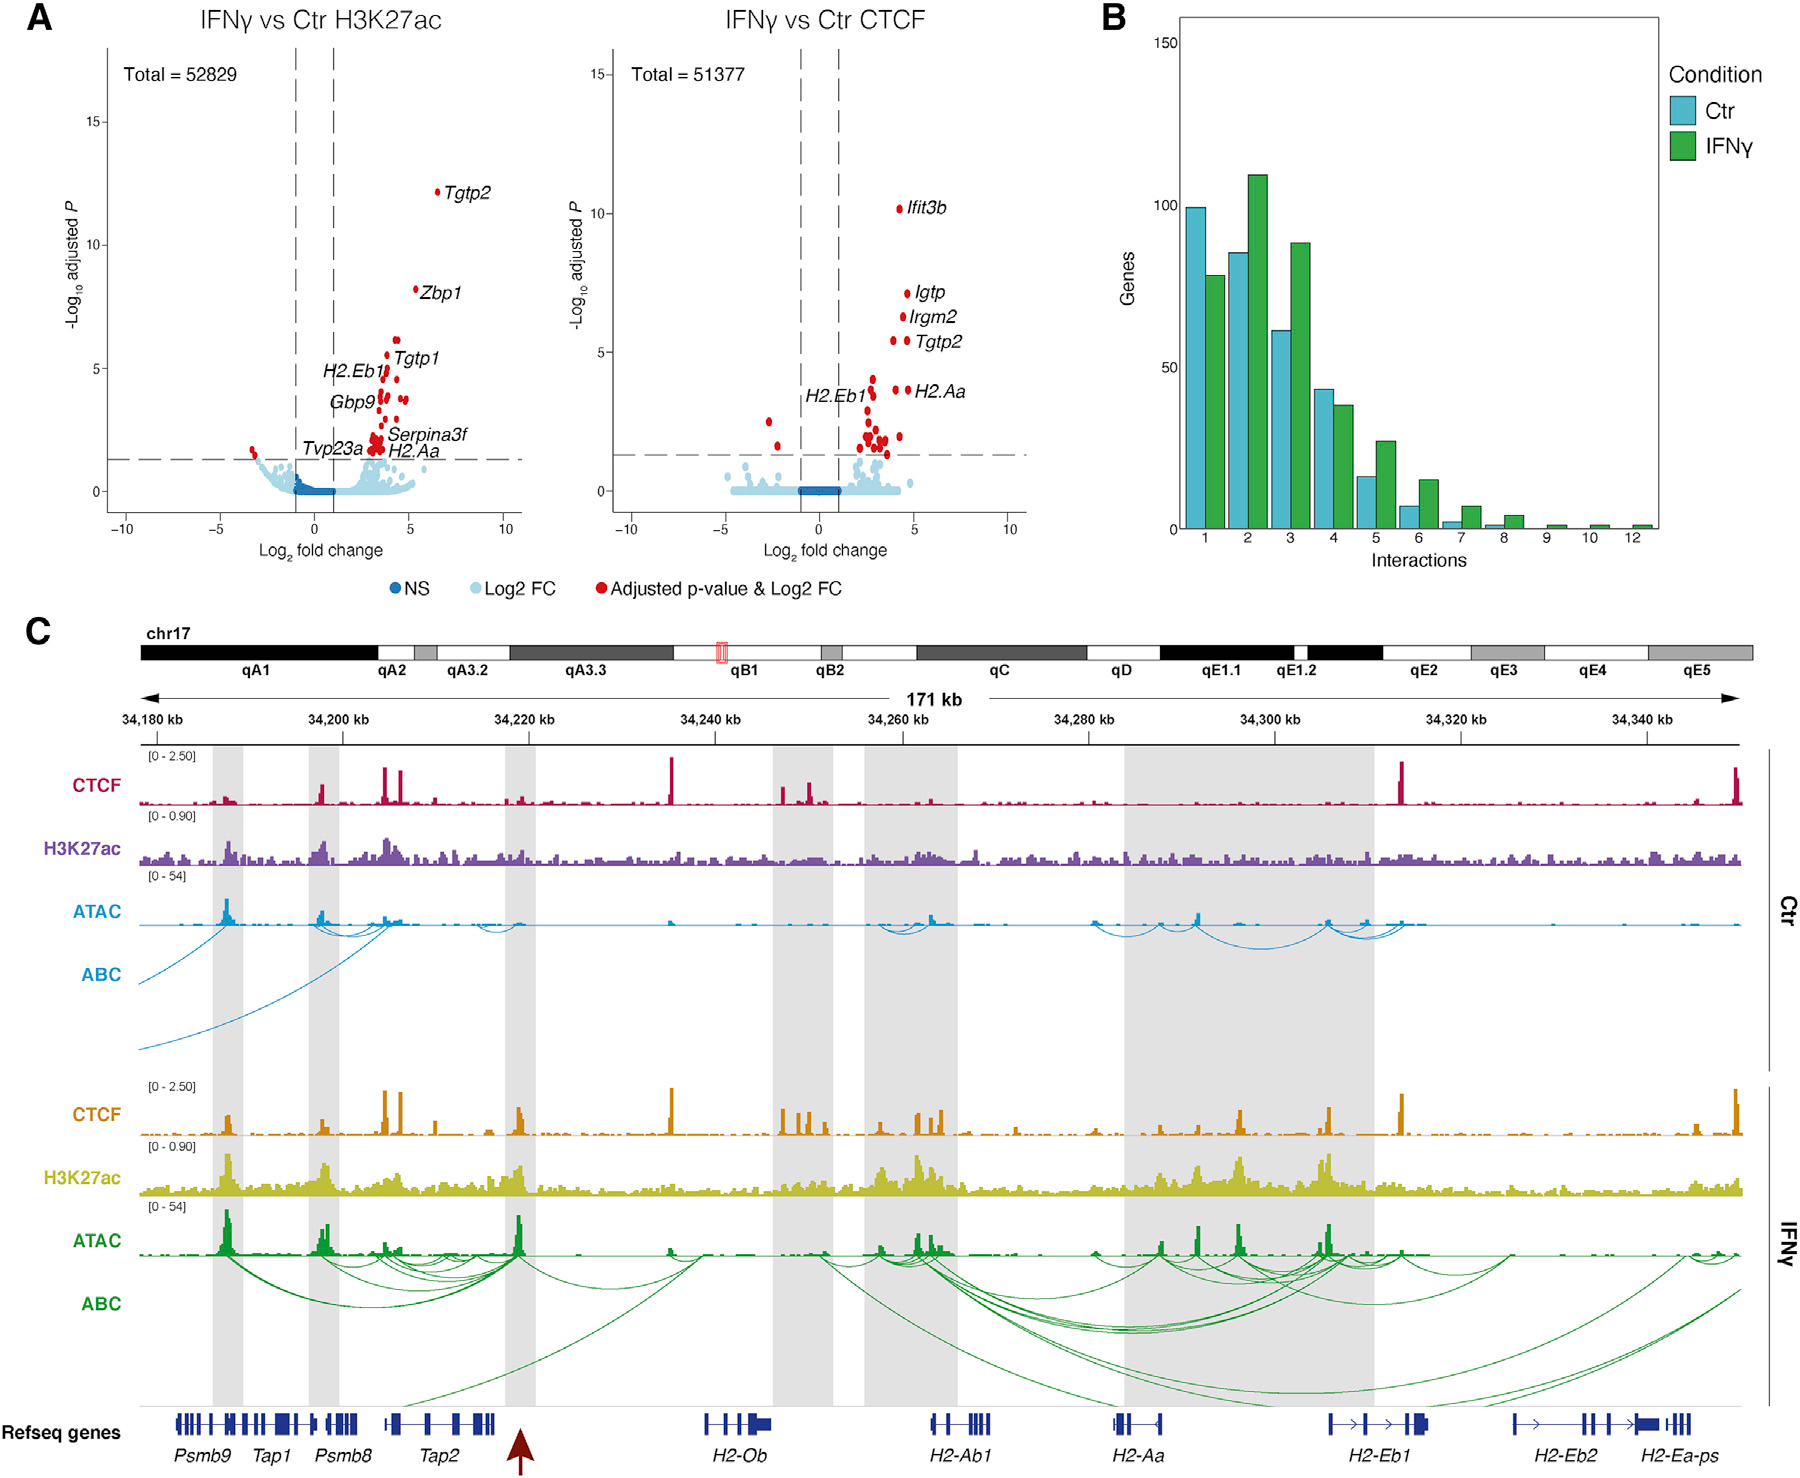
Figure 5. H3K27ac, CTCF binding, and enhancer-promoter contacts at immune genes in mouse OPCs are altered upon IFN-γ treatment.

(A) Volcano plots showing differential H3K27ac (left) and CTCF binding (right) between IFN-γ-treated OPCs and Ctr-OPCs, assessed with Cut&Run.3 biological replicates. Genes with adj. p value < 0.05 and log2 fold change >1.5 are shown in red.
(B) Number of genes (y axis) in Ctr-OPCs (blue) and IFN-γ-treated OPCs (green) with n predicted interactions (x axis).
(C) IGV tracks showing CTCF binding and H3K27ac occupancy, assessed with Cut&Run, ATAC-seq in IFN-γ-treated OPCs, and Ctr-OPCs for MHC-I and MHC-II loci. Predicted enhancer/promoter contacts computed by the activity-by-contact (ABC) model (Fulco et al., 2019) based on CA and H3K27ac-HiChIP. Highlighted with gray boxes are regions with increased H3K27ac, CTCF binding, CA, and/or predicted interactions in IFN-γ-treated OPCs. Highlighted with a red arrow is an enhancer region interacting with multiple genes in the MHC-I and MHC-II loci. Merged tracks for 3 biological replicates per condition.
