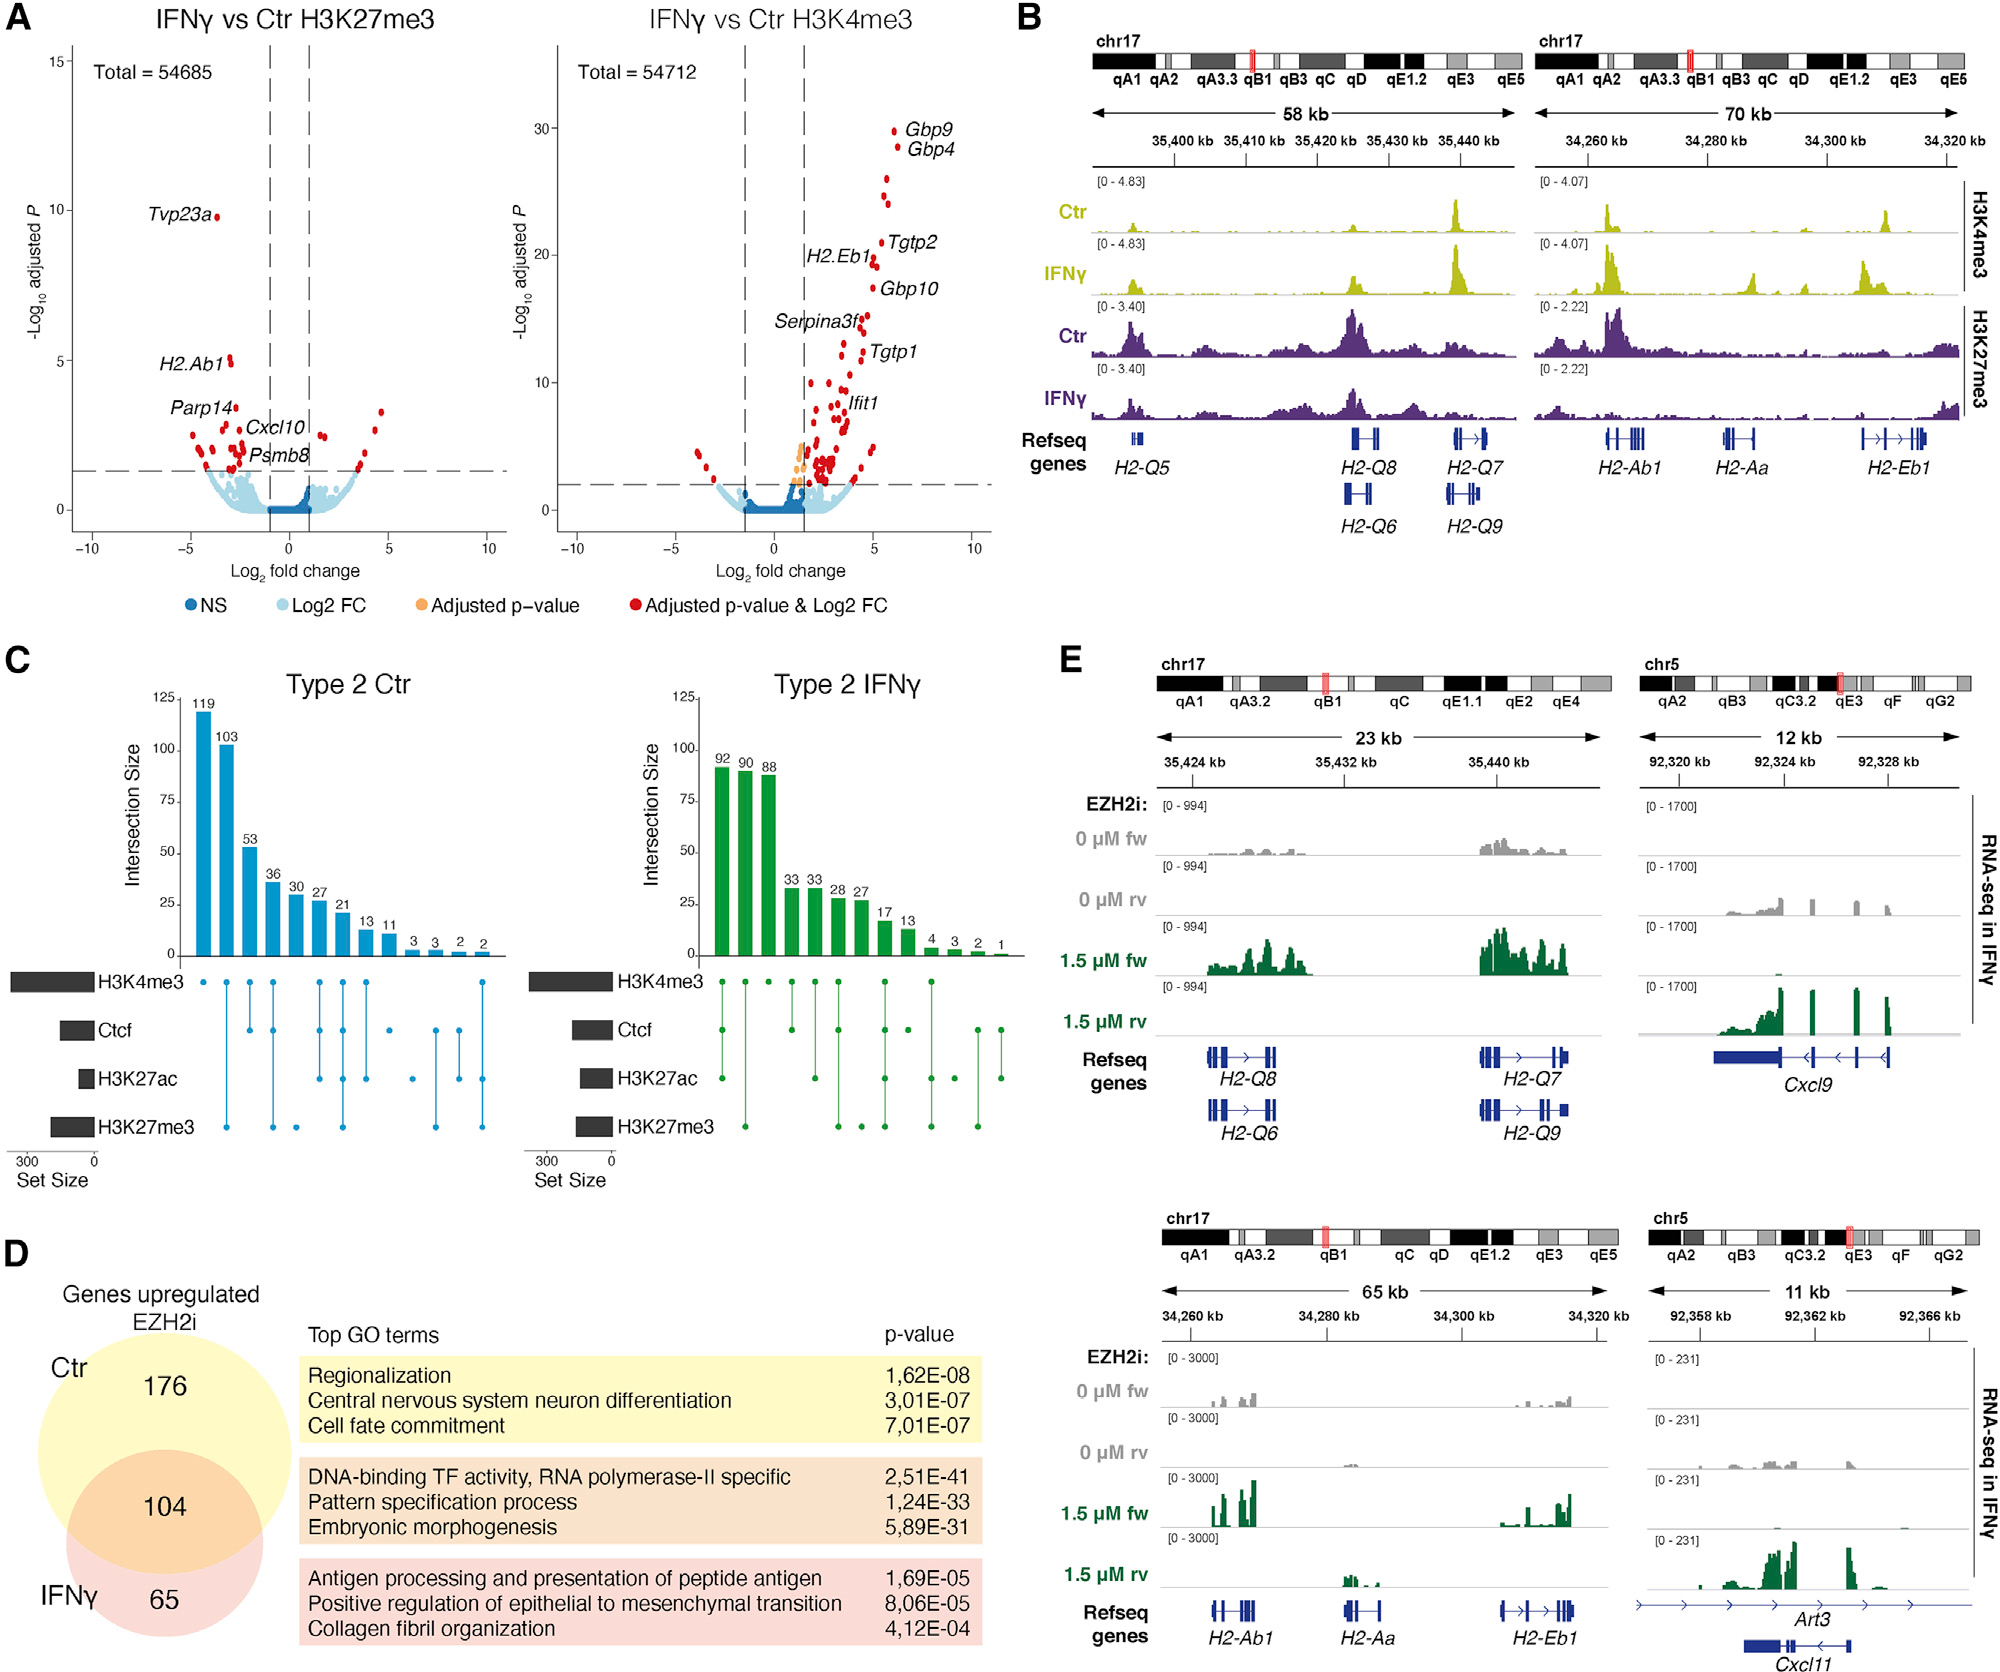
Figure 6. H3K27me3 modulation is involved in IFN-γ-mediated immune gene activation in OPCs.

(A) Volcano plots for H3K27me3 and H3K4me3 in IFN-γ-treated OPCs versus Ctr-OPCs assessed with Cut&Run. Two replicates. Genes with adj. p value < 0.05 and log2 fold change >1.5 are shown in red.
(B) Cut&Run IGV tracks for selected MHC-I and MHC-II genes with increased H3K4me3 or decreased H3K27me3 in OPCs upon IFN-γ treatment. Merged tracks of two replicates.
(C) Upset plots of Cut&Run Ctr-OPCs and IFN-γ-treated peak intersection in Type2 genes. Top barplot shows the number of intersecting peaks per combination, left barplot shows the size of each peak dataset, and the matrix shows the Cut&Run peak sets (dots) and shared (connecting line) in each combination.
(D) Venn diagram showing the number of genes enriched in OPCs upon treatment with 1.5 μM EZH2 inhibitor EPZ011989 (EZH2i) for 4 days, with and without subsequent co-treatment with 100 ng/mL IFN-γ for last 6 h (and the genes enriched in both) and the top gene ontology biological terms for the genes in each category.
(E) RNA-seq IGV tracks for MHC-I, MHC-II, and cytokine genes with increased expression upon EZH2i in IFN-γ-spiked OPCs. Merged tracks of three biological replicates.
