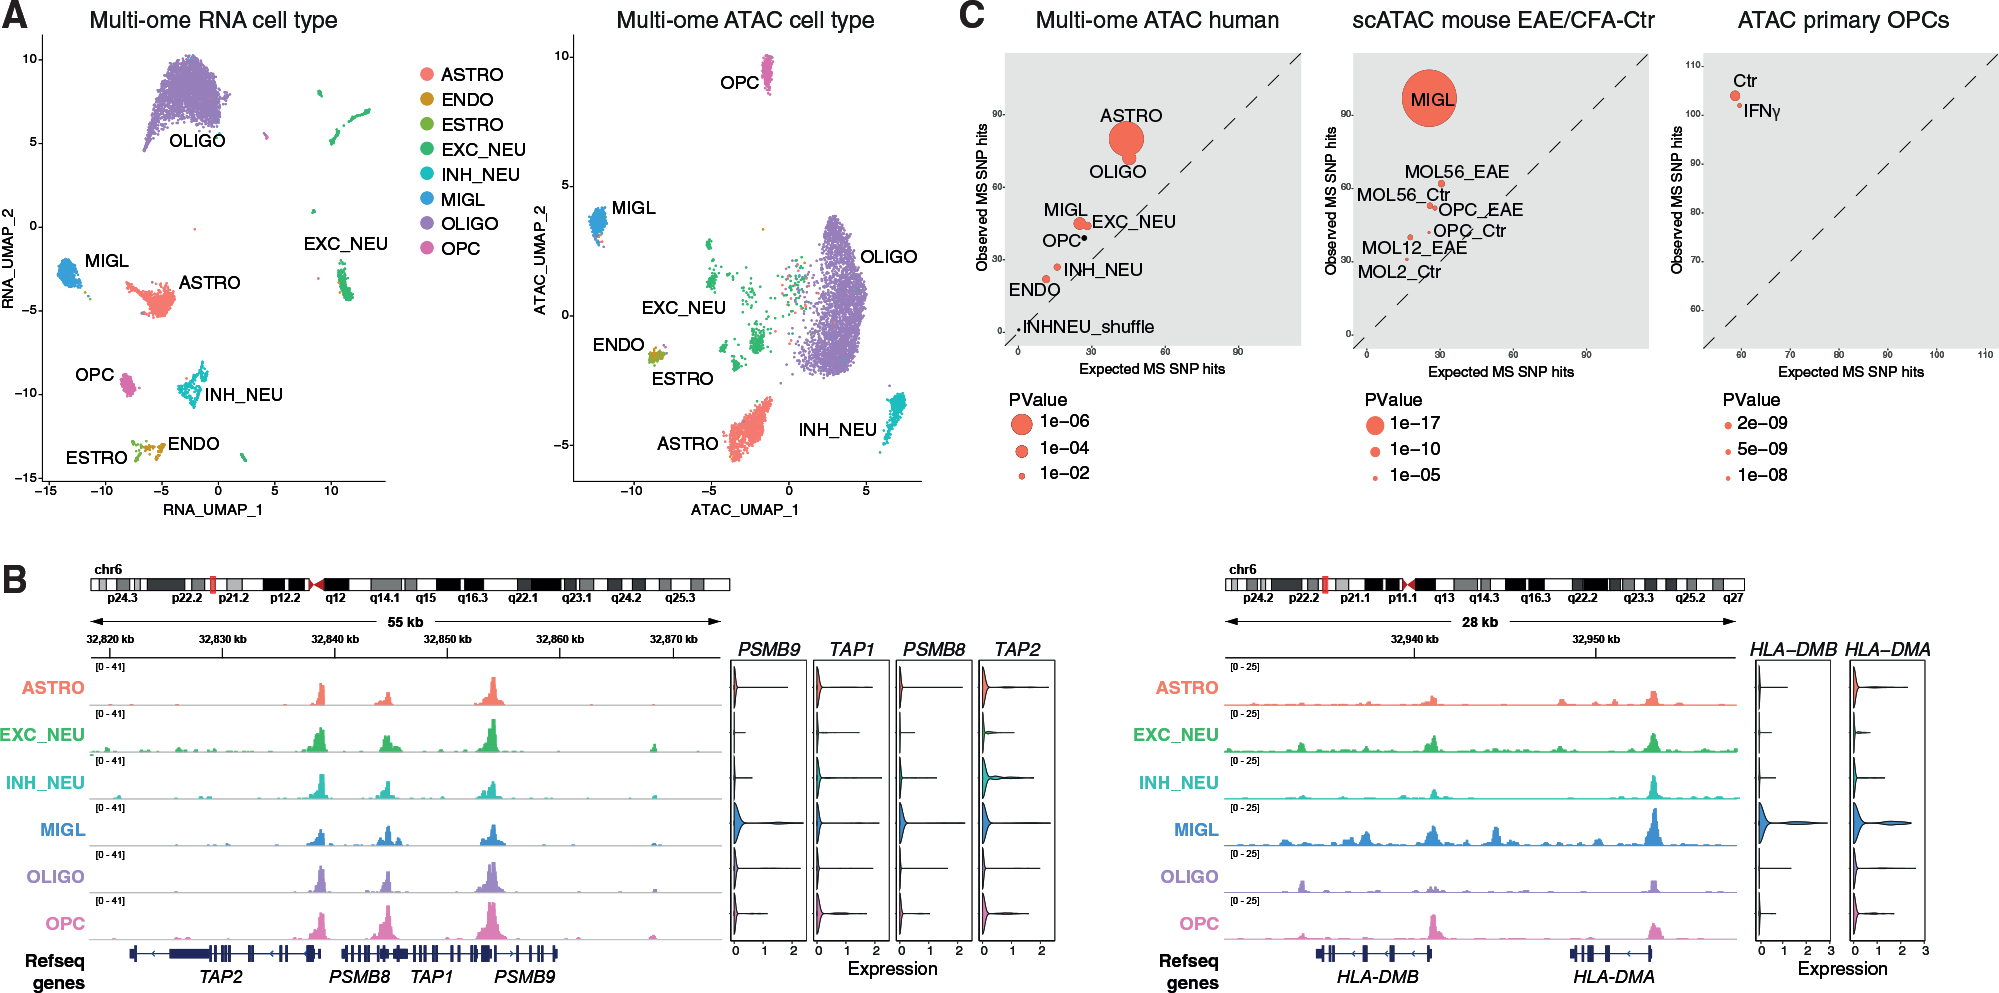
Figure 7. Primed CA at immune gene loci in human neural cells.

(A) UMAP based on CA (right) and RNA-seq (left) of 10x Genomics multi-ome of brain gray matter from two healthy individuals.
(B) IGV tracks of CA for each selected cluster (hg38). Violin plots depicting the expression of selected genes in each individual cluster.
(C) Overlap with MS-associated GWAS variants. For each peak set, expected (x axis) versus observed (y axis) number of SNP hits overlapping the human healthy individuals hg19 multi-ome scATAC-seq peaks, scATAC-seq cell-type-specific peaks from Ctr and EAE mice, and Ctr-OPC and IFN-γ-treated primary OPC ATAC-seq peaks. Dot size scaled to adjusted p value and adjusted p values < 0.01 in red. ENDO, endothelial cells; ASTRO, astrocytes; EXCNEU, excitatory neurons; INHNEU, inhibitory neurons; MIGL, microglia; OLIGO or MOL, mature oligodendrocyte; OPC, oligodendrocyte precursor cell; VLMC, vascular leptomeningeal cell; PLC, pericyte-like cell.
